Better Collective had just bought some of Brazil’s biggest sports media brands, but knew little about the people reading them. I combined desk research, two national surveys and in-depth interviews to map who these fans are, why they bet, and where our brands stood against the market.
- Company
- Better Collective
- Year
- 2024
- Role
- UX Researcher, Brazilian market
- Scope
- Desk research, surveys, interviews, segmentation
A global sports media group, new to the world’s most football-minded market.
Better Collective is a Danish digital sports media group, with content that reaches more than 180 million fans a month. In Brazil, it was growing through acquisitions: some of the country’s best-known sports and betting sites joined the group.
I was the researcher in Rio, part of a four-person UX Research team spread across Copenhagen, Niš and Lisbon, focused on the Brazilian market.
Grow brands in a market we didn’t know yet.
Brazilian sports culture is deeply shaped by football, family and friends, and betting was moving toward regulation. Marketing, content and product teams were making decisions without a shared picture of who they were talking to. The research had to answer four questions:
Who are they?
The segments within Brazilian sports fans, and what sets each one apart.
How do they behave?
Motivations, betting frequency, decision making and the platforms they use.
What holds non-bettors back?
How stigma, knowledge and regulation shape the choice not to bet.
Where do our brands stand?
Awareness, preference and loyalty against the market leaders.
Five methods, each one covering what the others couldn’t.
Each method answered a different question. Desk research set the ground, the surveys measured what fans do, and the interviews explained why. Crossing all of them, known as triangulation, gave the findings statistical confidence and kept the blind spots of any single method in check.
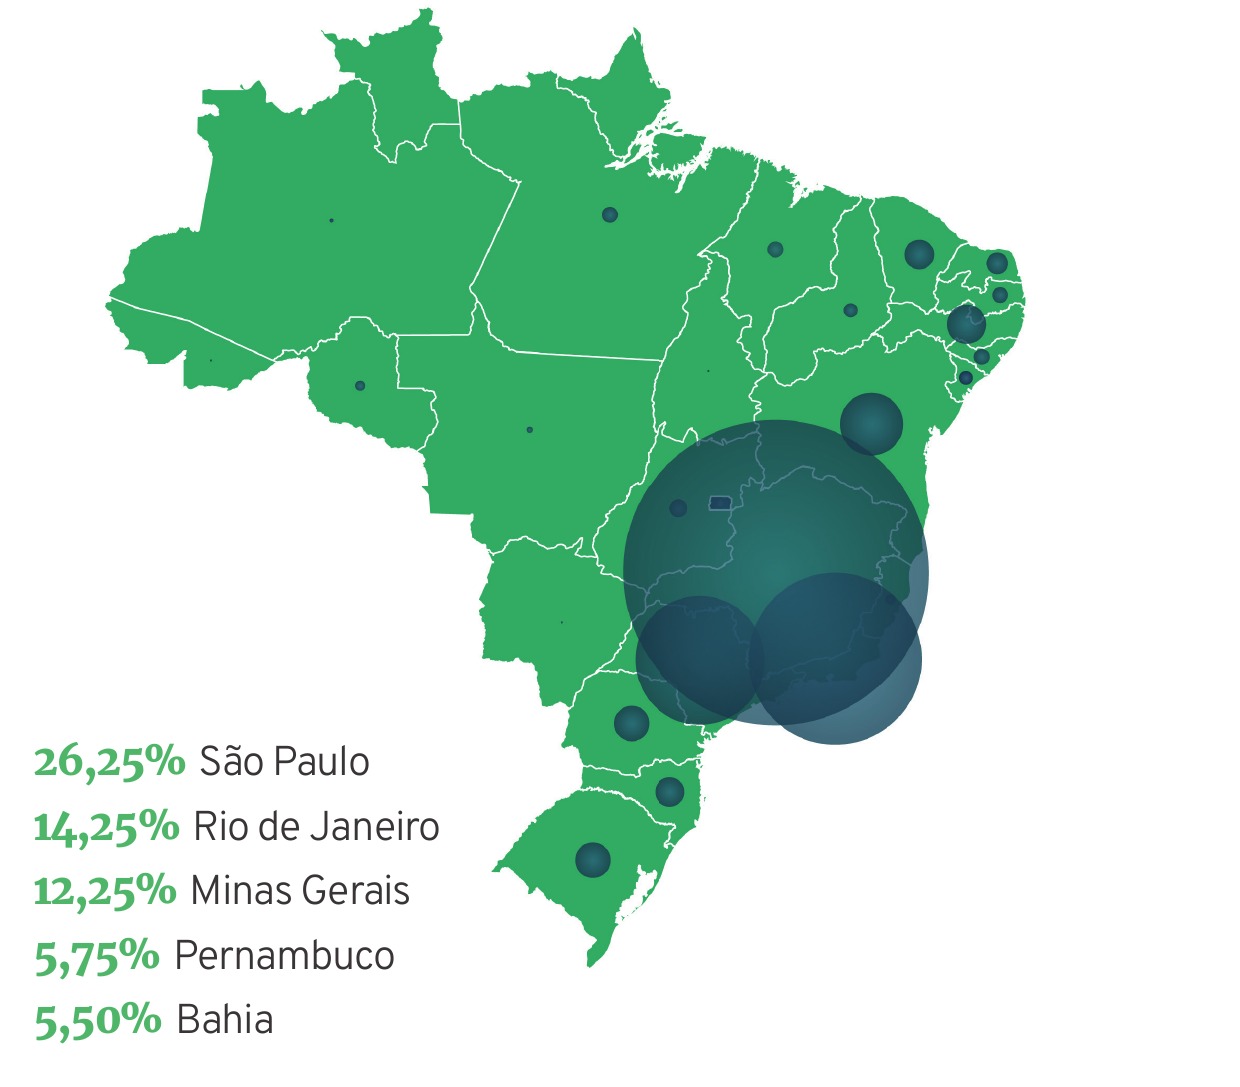
Audience survey
A national survey with bettors and non-bettors alike, since the company’s strategy covered the whole sports market, not only betting. Habits, preferences, motivations and channels.
In-depth interviews
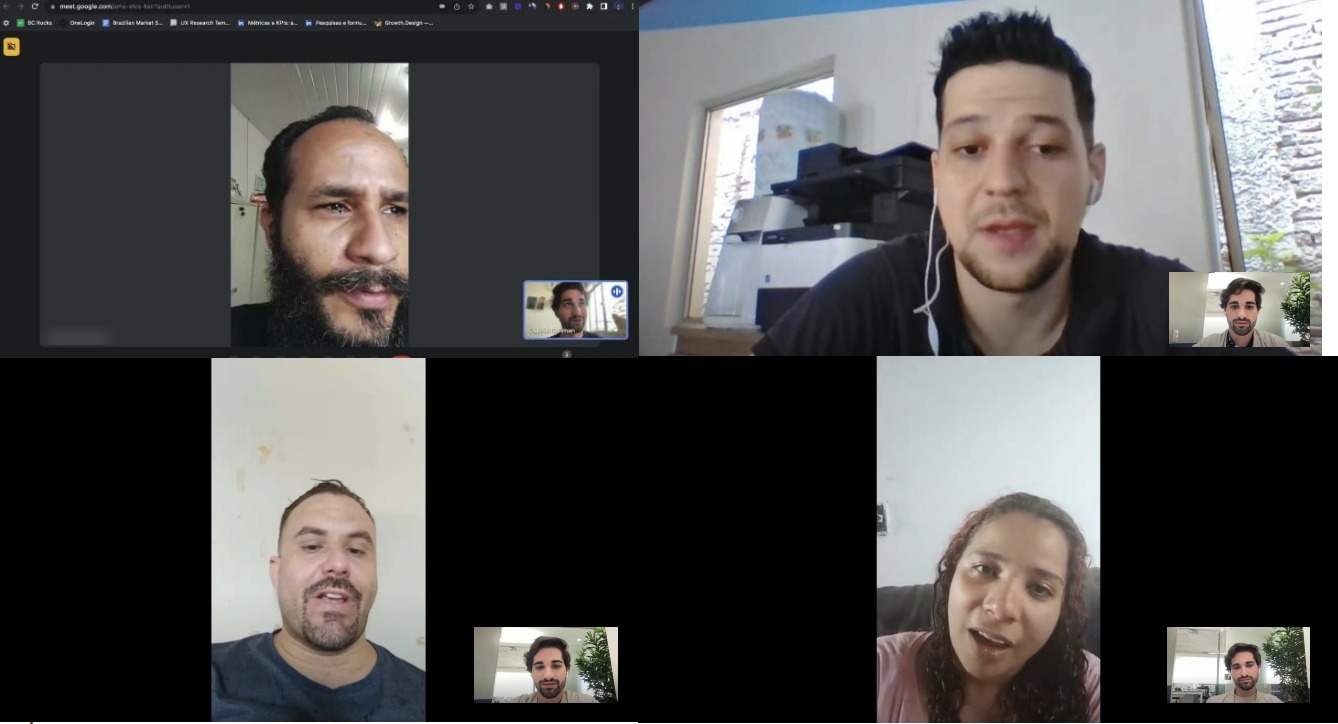
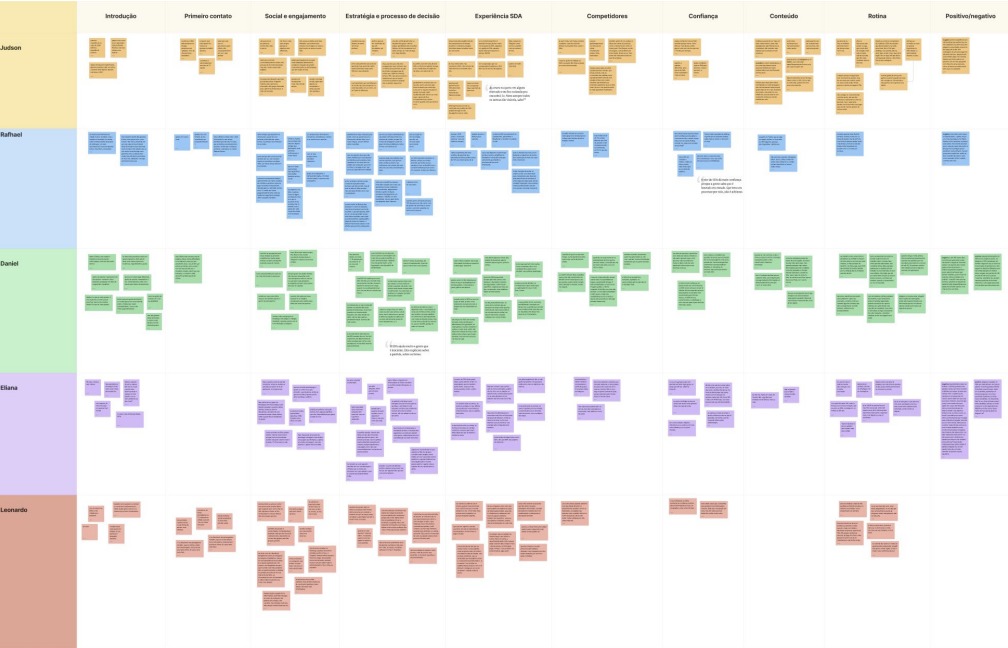
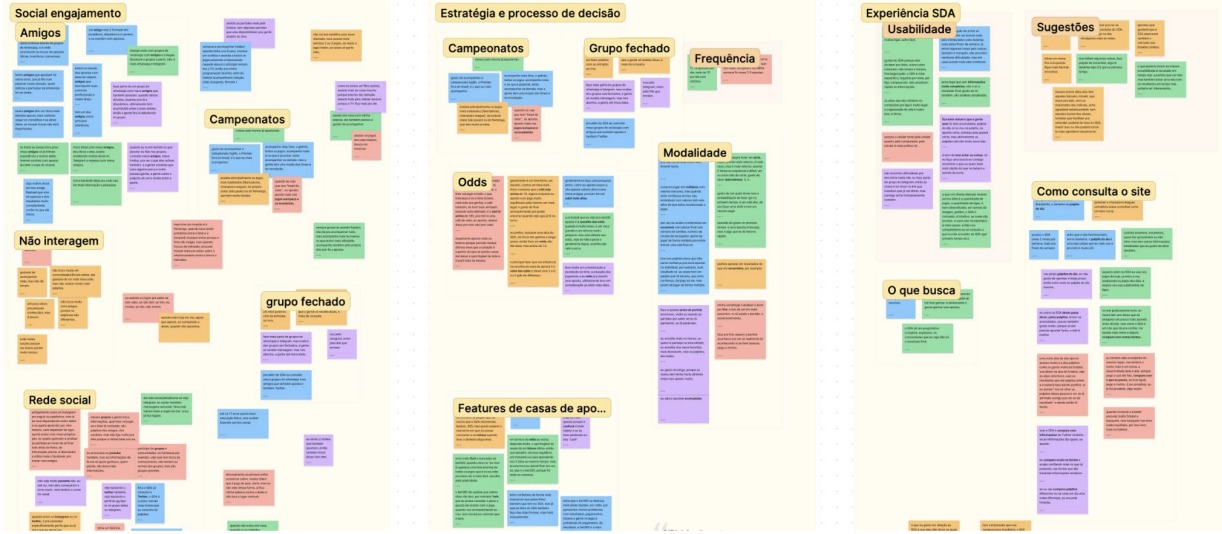
Five remote interviews with Sites de Apostas users, recruited from the brand’s Telegram group. I clustered every note by semantic similarity to find patterns and outliers.
Brand awareness survey
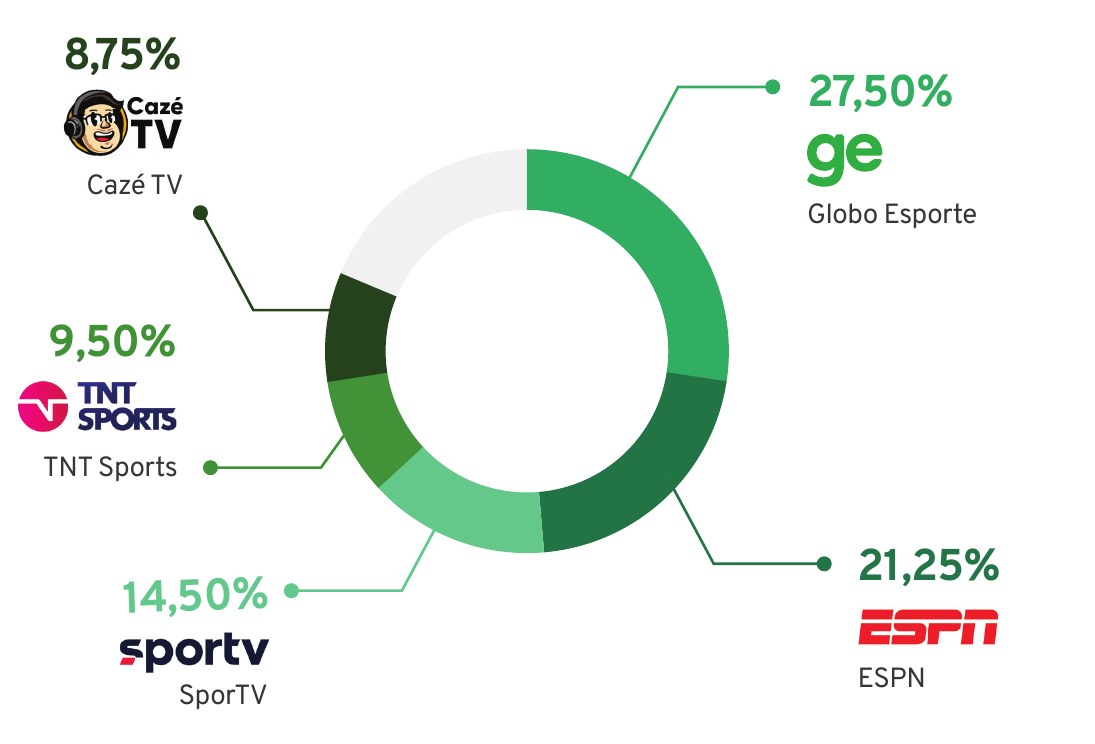
A second survey with 400 people on the brands they know, use and prefer, plus traffic and social media data for each one, to see where Better Collective’s brands stood.
Behavior on our own pages
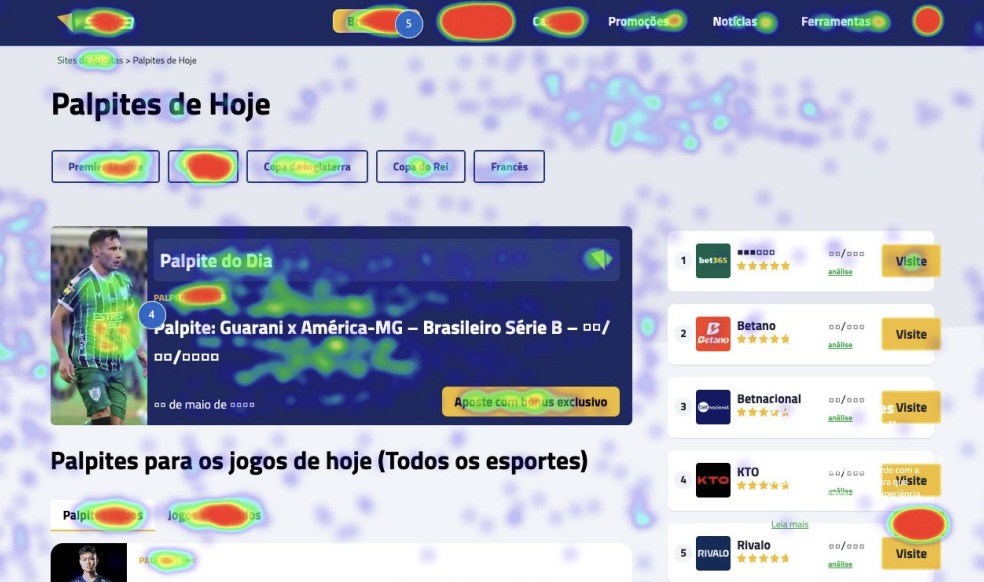
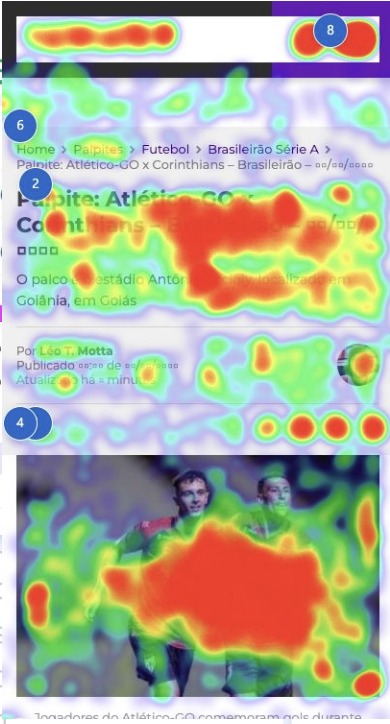
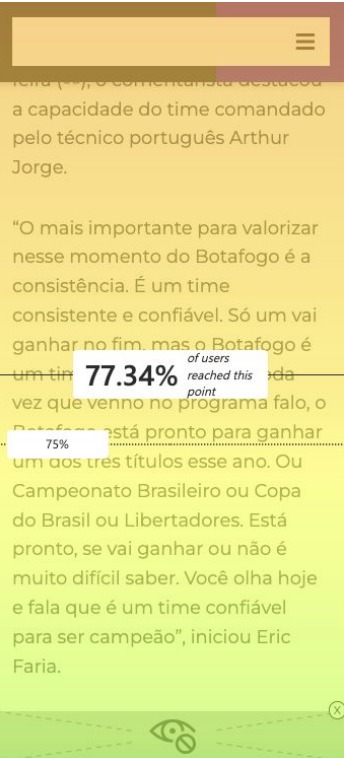
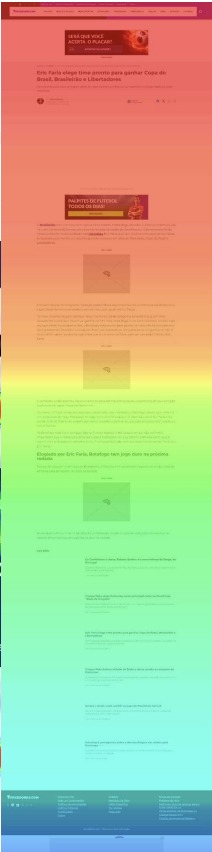
Heatmaps and scroll maps on the group’s tips and news pages showed what fans actually click and how far they read, a check against what they told us in surveys and interviews.
From 800 answers and five conversations to patterns.
I crossed every survey answer by bettor and non-bettor, age group and gender, and followed each brand through four funnel stages: aware, used in the last 30 days, used in the last 7 days, and preferred. The interviews explained the numbers behind those cuts.
Where people drop off, brand by brand.
Share of 400 respondents at each stage. The gap between knowing a brand and preferring it says more than awareness alone.





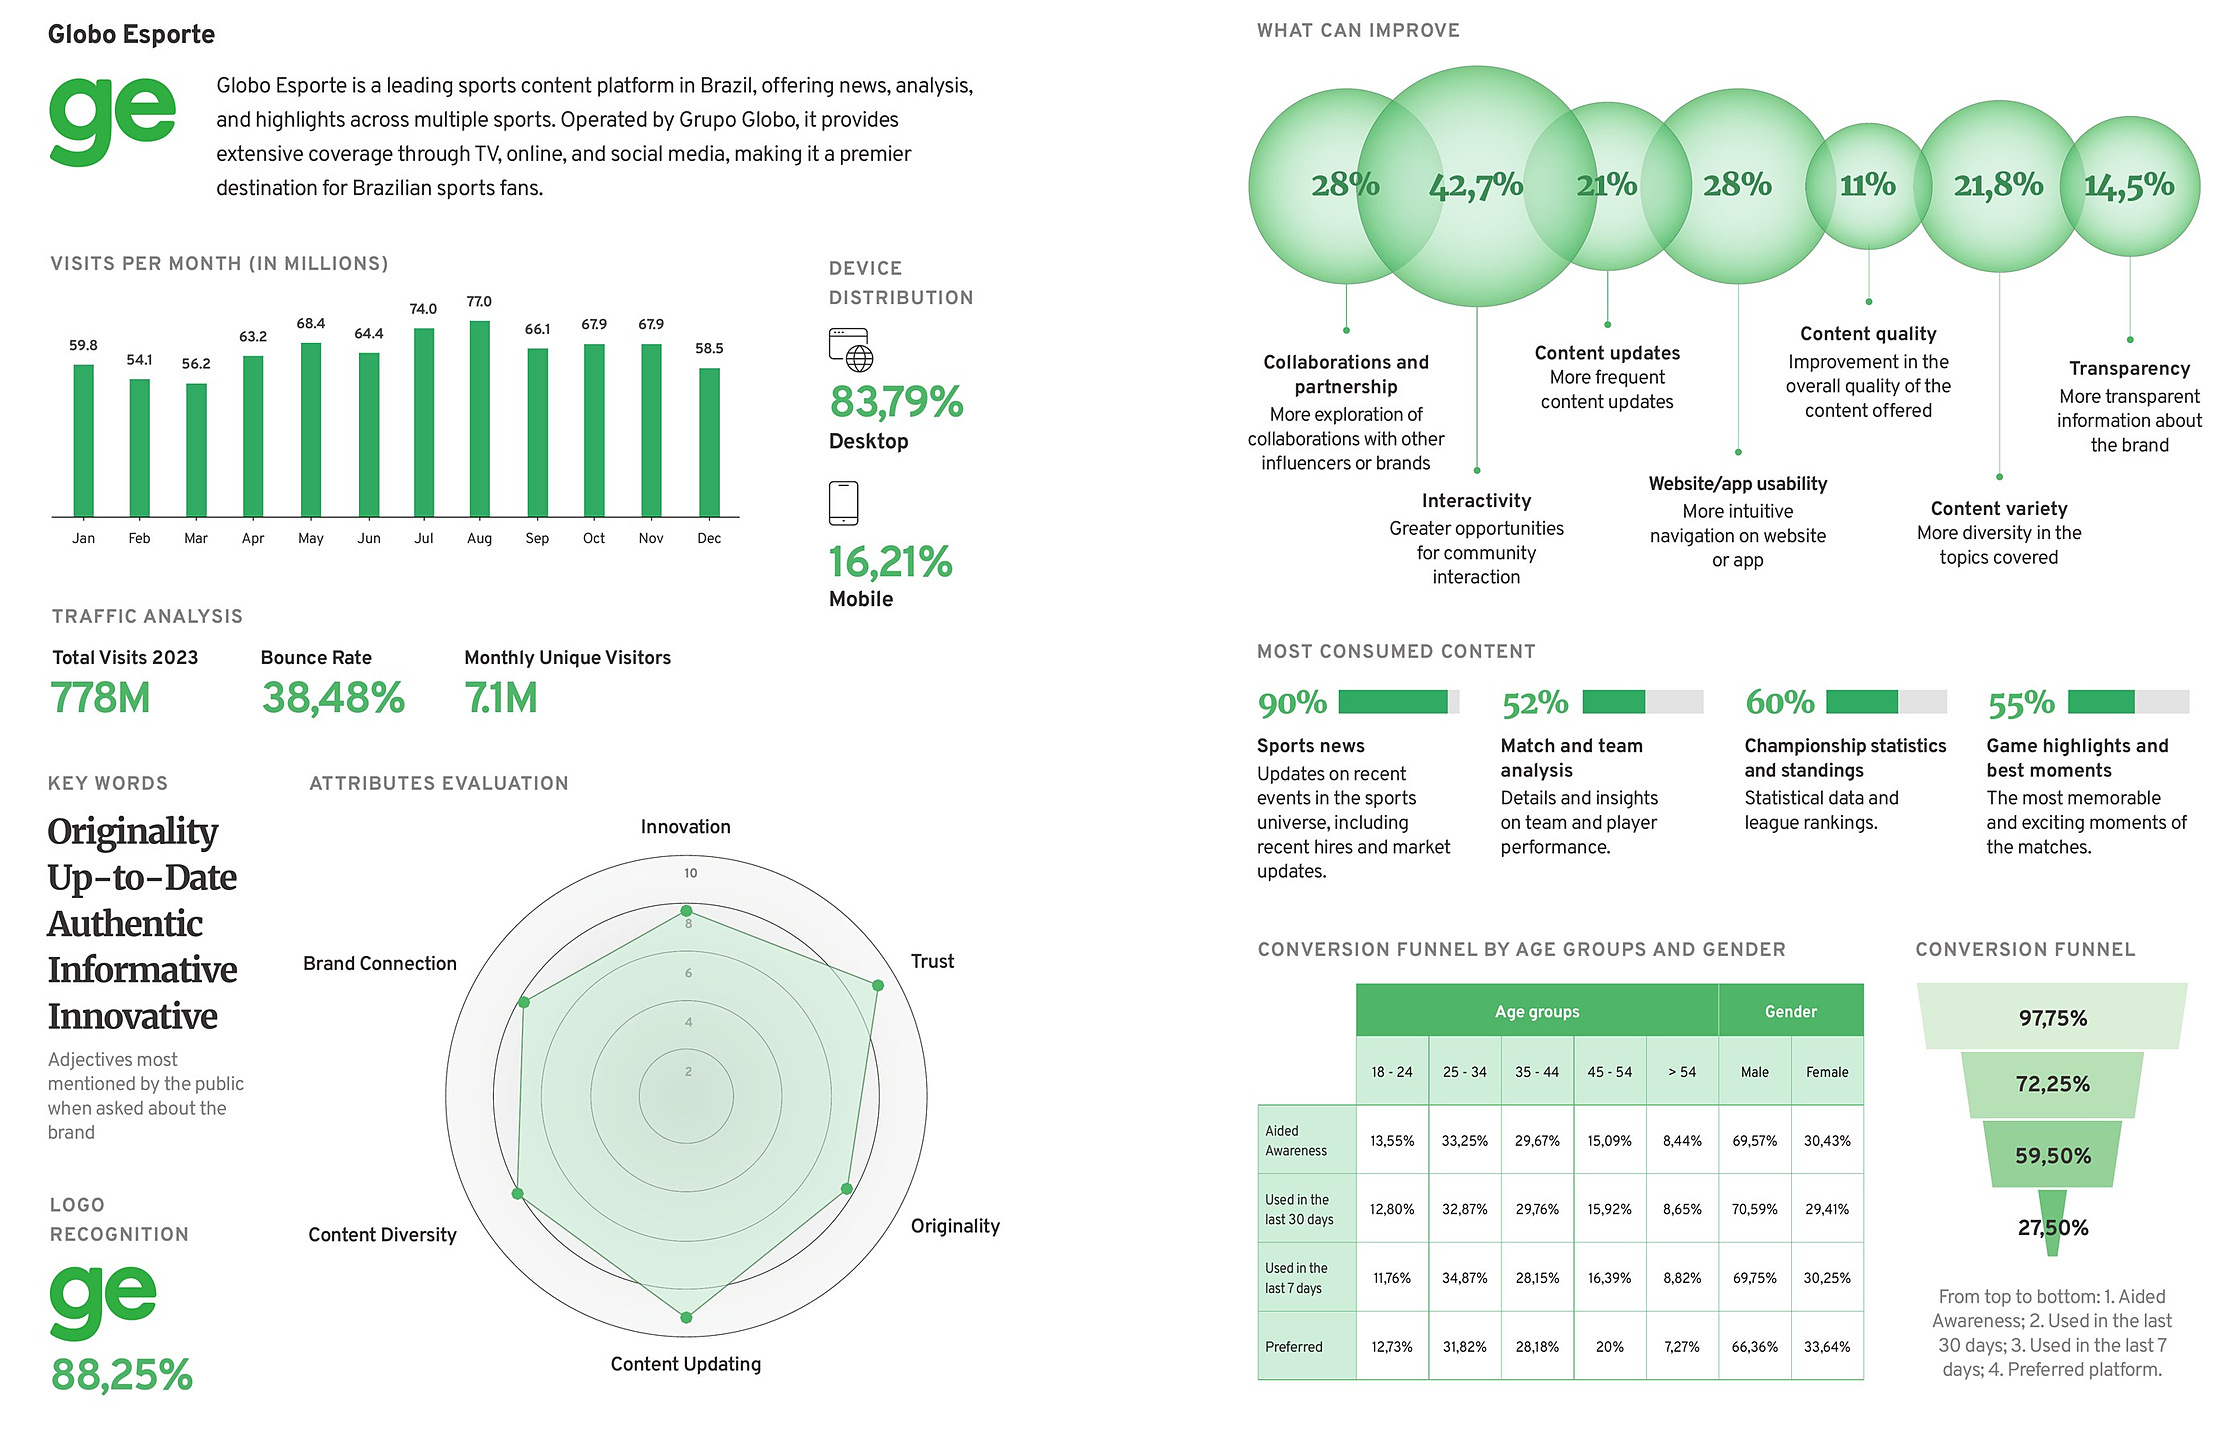
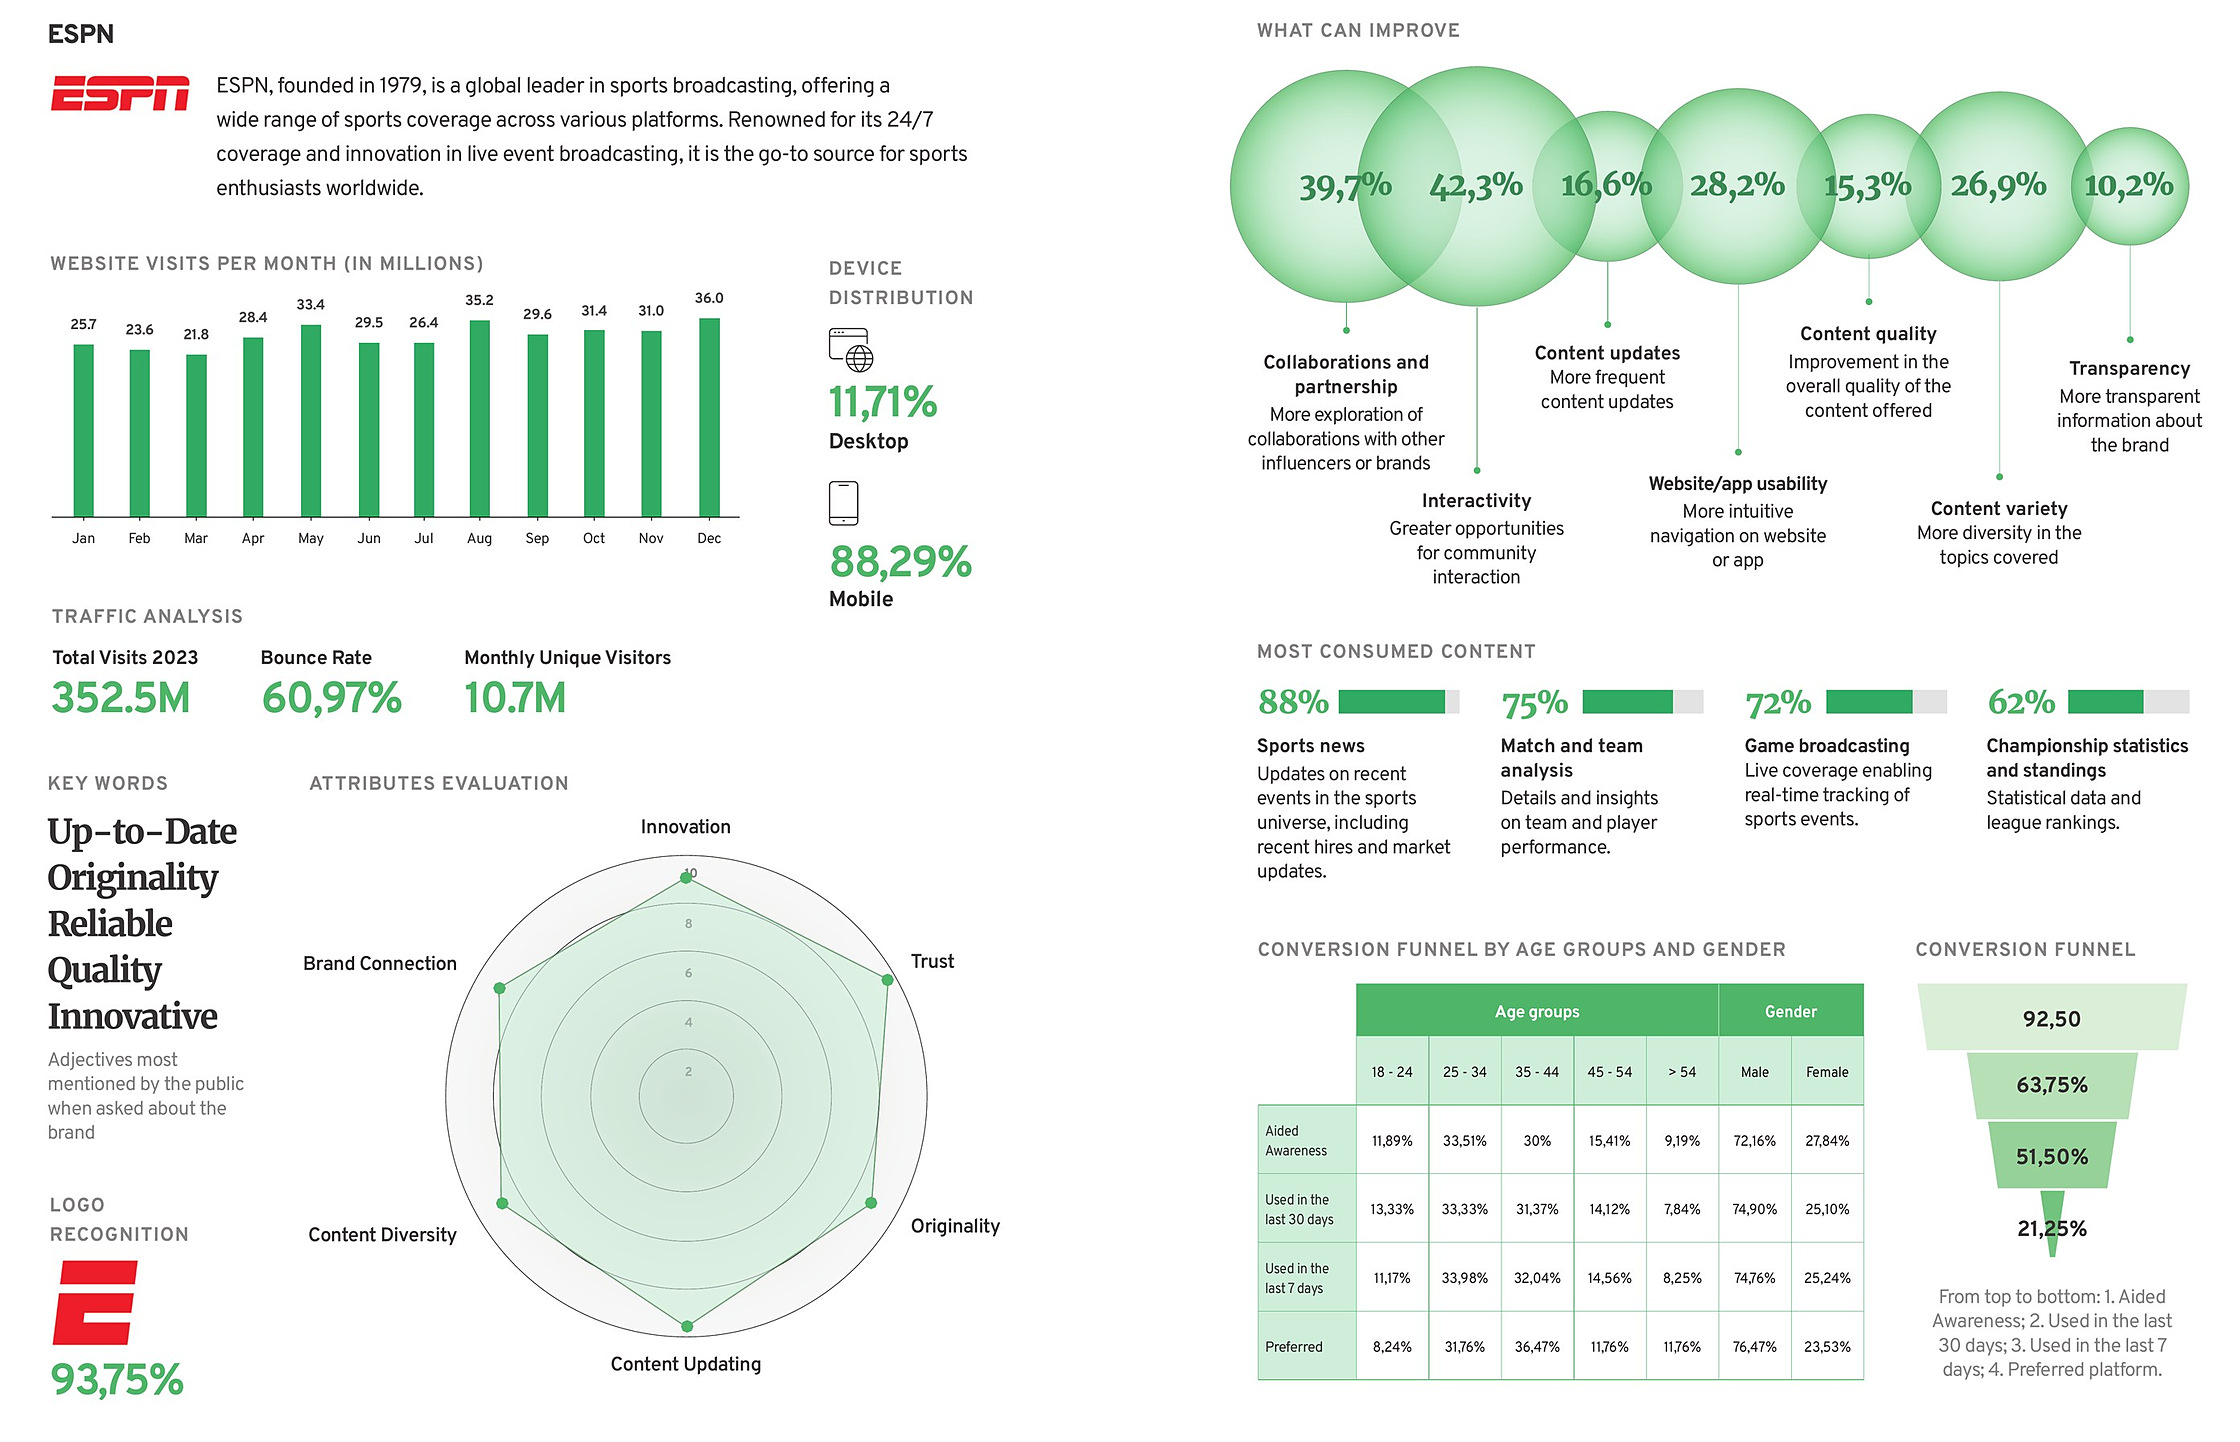
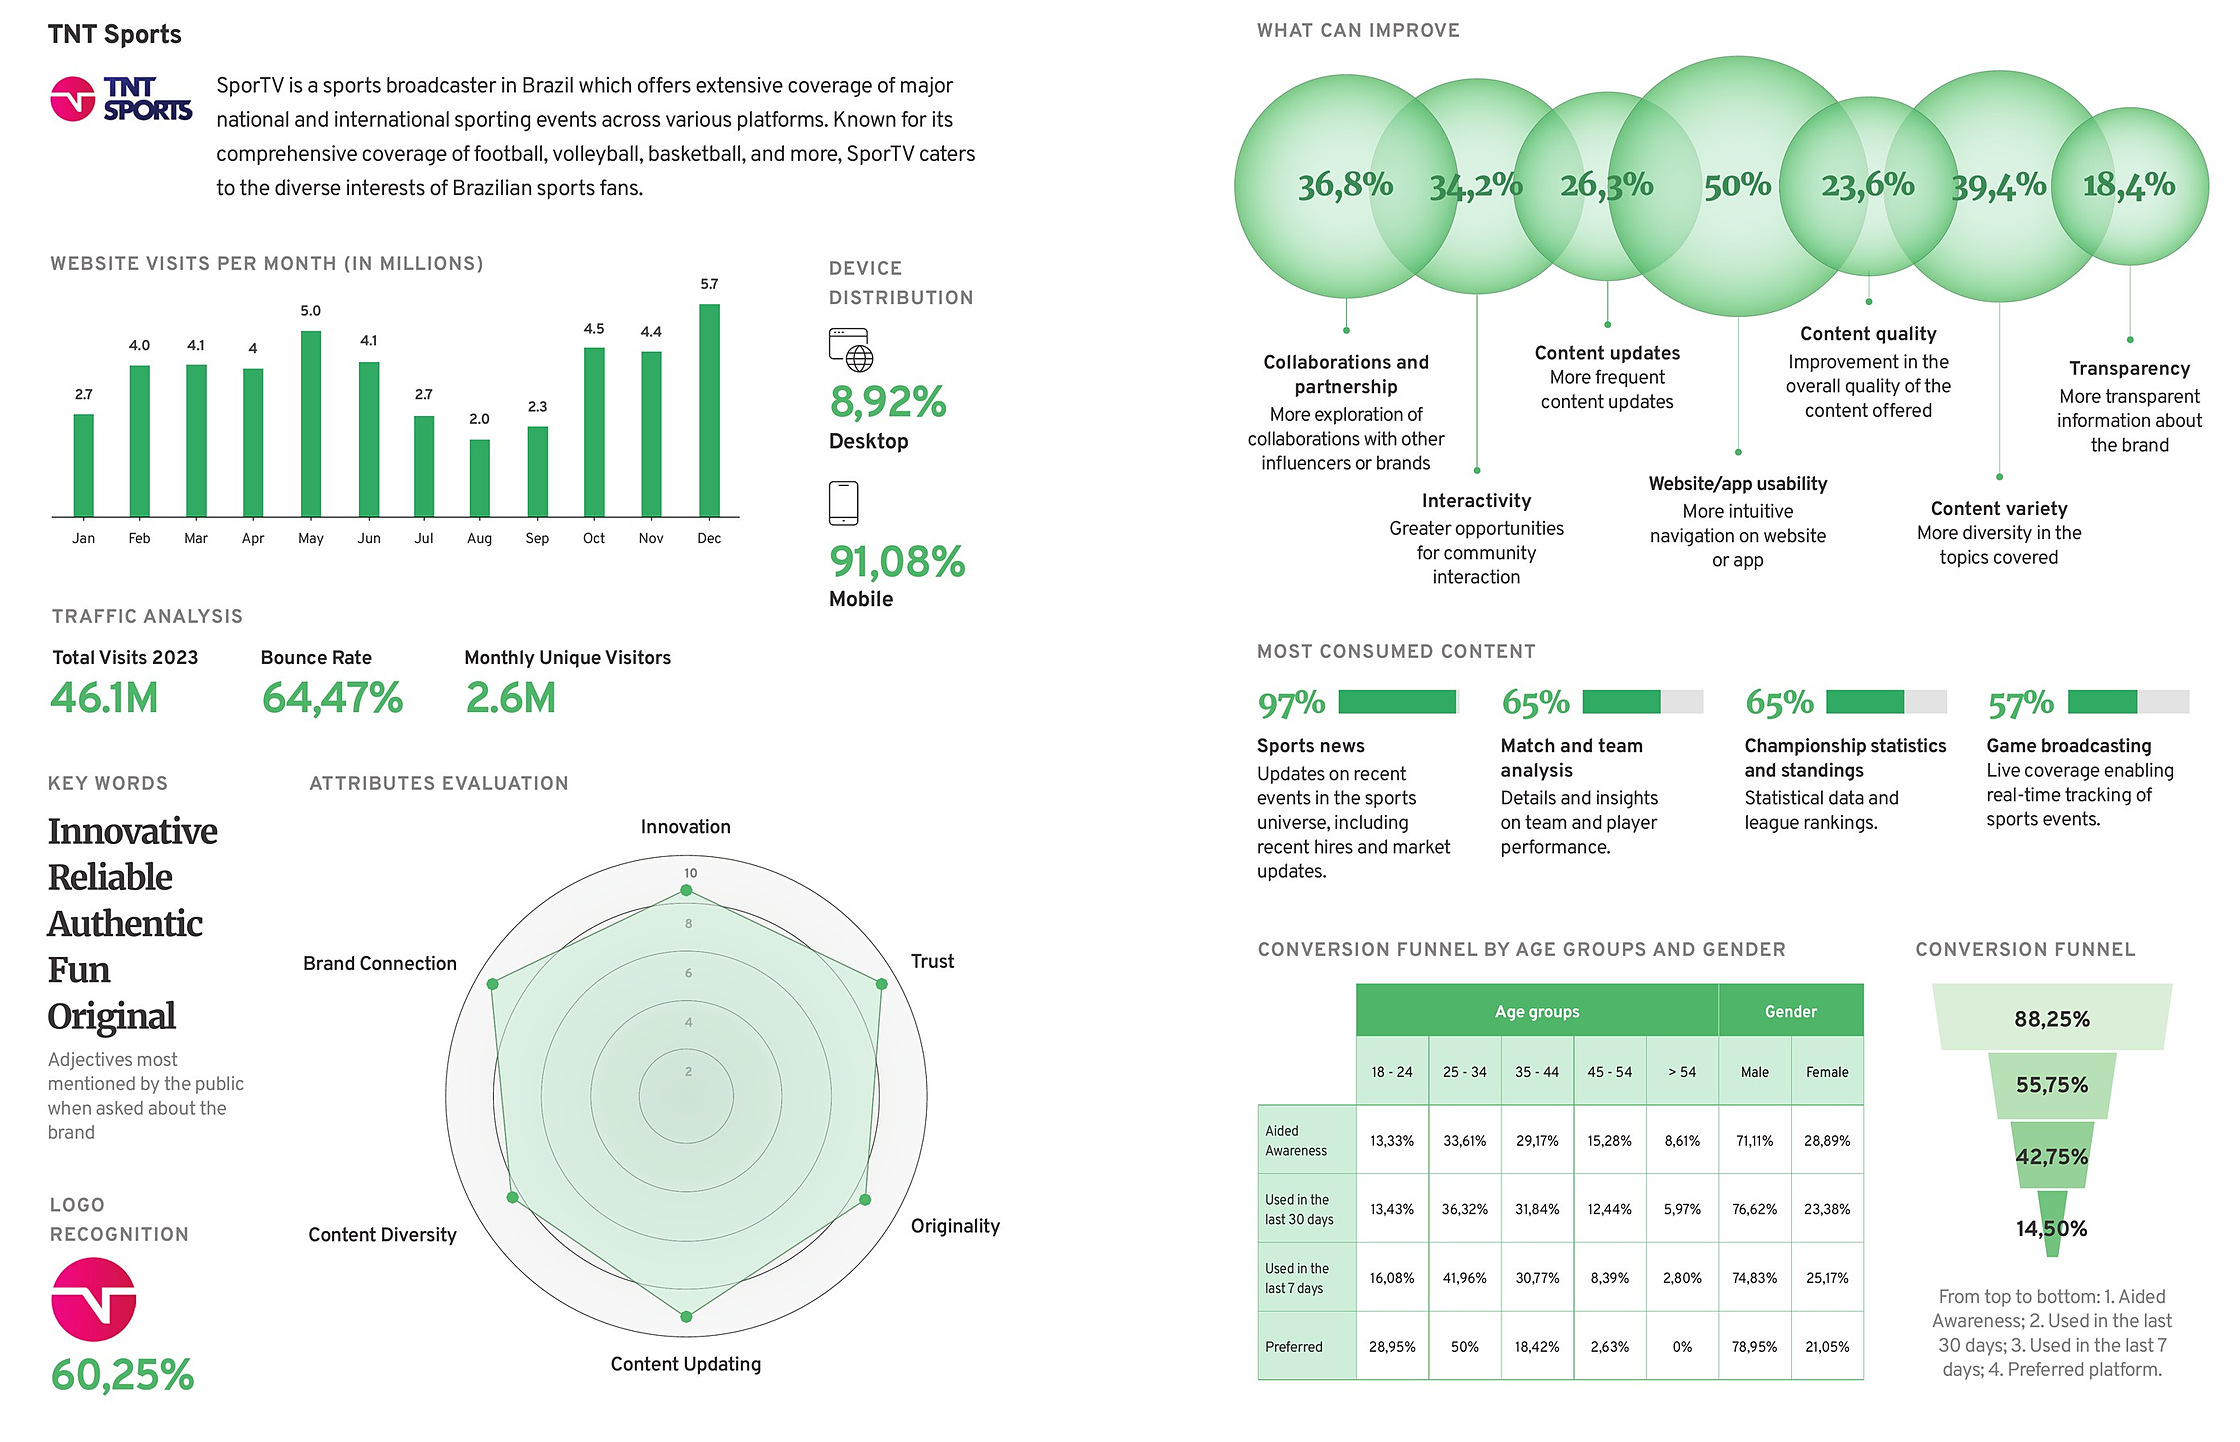
One template, three market leaders.
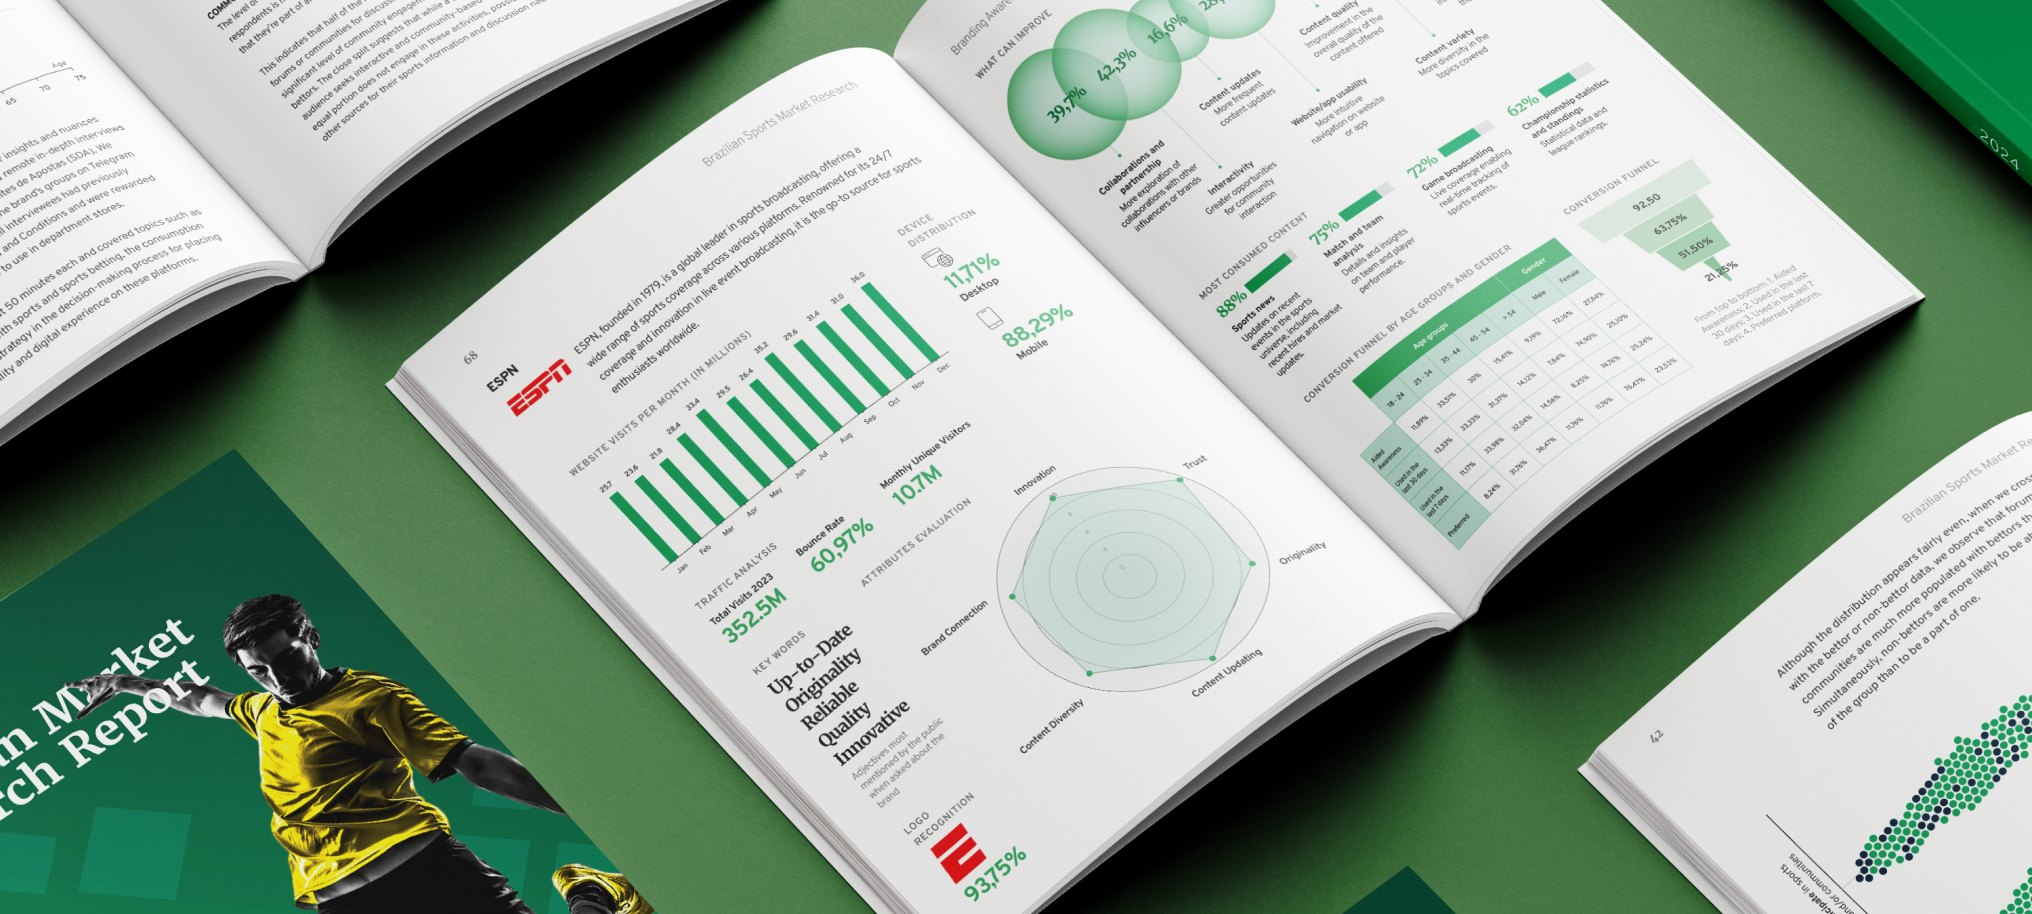
I built one analysis spread per leading brand: monthly traffic from Similarweb, device split, the words people use for it, an attribute radar, what fans would improve, what they read most, and its funnel by age and gender.
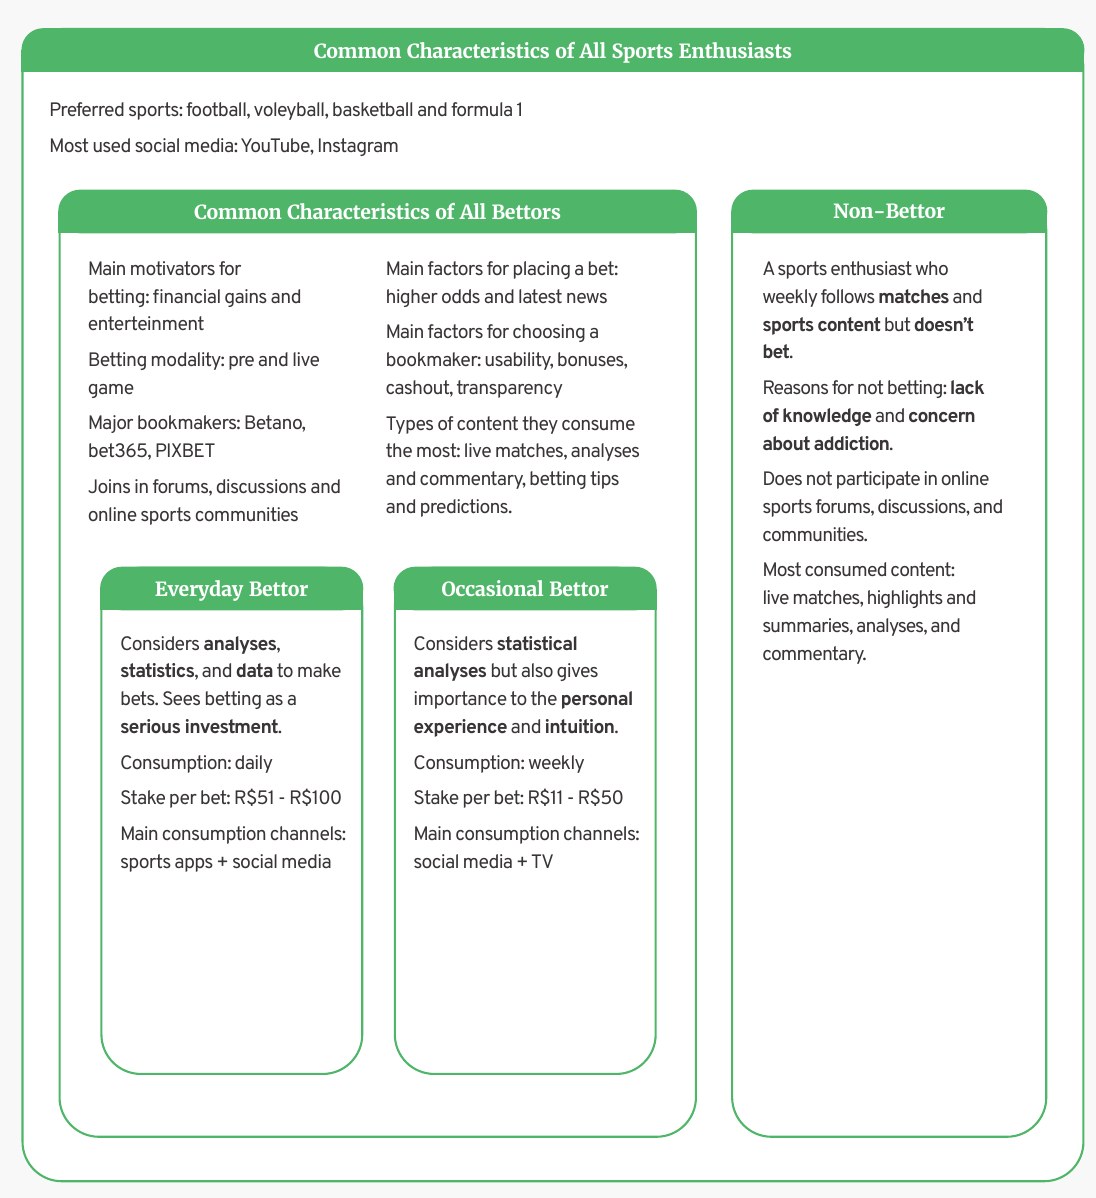
What all fans share, and what sets each profile apart.
Before writing personas, I mapped the traits common to every sports fan, the ones only bettors share, and the ones unique to each profile. That map became the backbone of the segmentation.
Six findings I brought to the company.
Betting is a weekly habit, and the younger the fan, the more often they bet.
83% of respondents had placed a sports bet, and almost half of them bet a few times a week. Crossing frequency with age, people aged 25 to 34 are the biggest group among those who bet every day, a few times a week or once a week, and together with 18 to 24 they are close to 7 in 10 of those who bet every day. Fans over 45 bet less often. So paid campaigns and boosts for high-frequency products should aim at under-35s first.
Money comes first, fun close behind.
For many, betting is a way to feel the game more, and a test of what they know.
Most bettors mix data and gut feeling.
A third treat betting as a serious investment. Few bet without any analysis.
Non-bettors aren’t against betting. They don’t understand it.
Lack of knowledge is the main reason not to bet, ahead of addiction concerns. Only about one in ten finds betting unacceptable, and most hold no strong opinion at all.
Awareness isn’t loyalty.
Globo Esporte and ESPN lead from awareness to preference. TNT Sports is known by 90% of the audience but preferred by fewer than 1 in 10, while CazéTV, born on YouTube, grew its Instagram audience more than tenfold in 2023 by talking to younger fans in their own formats.
Fans live on social media, and bettors live in communities.
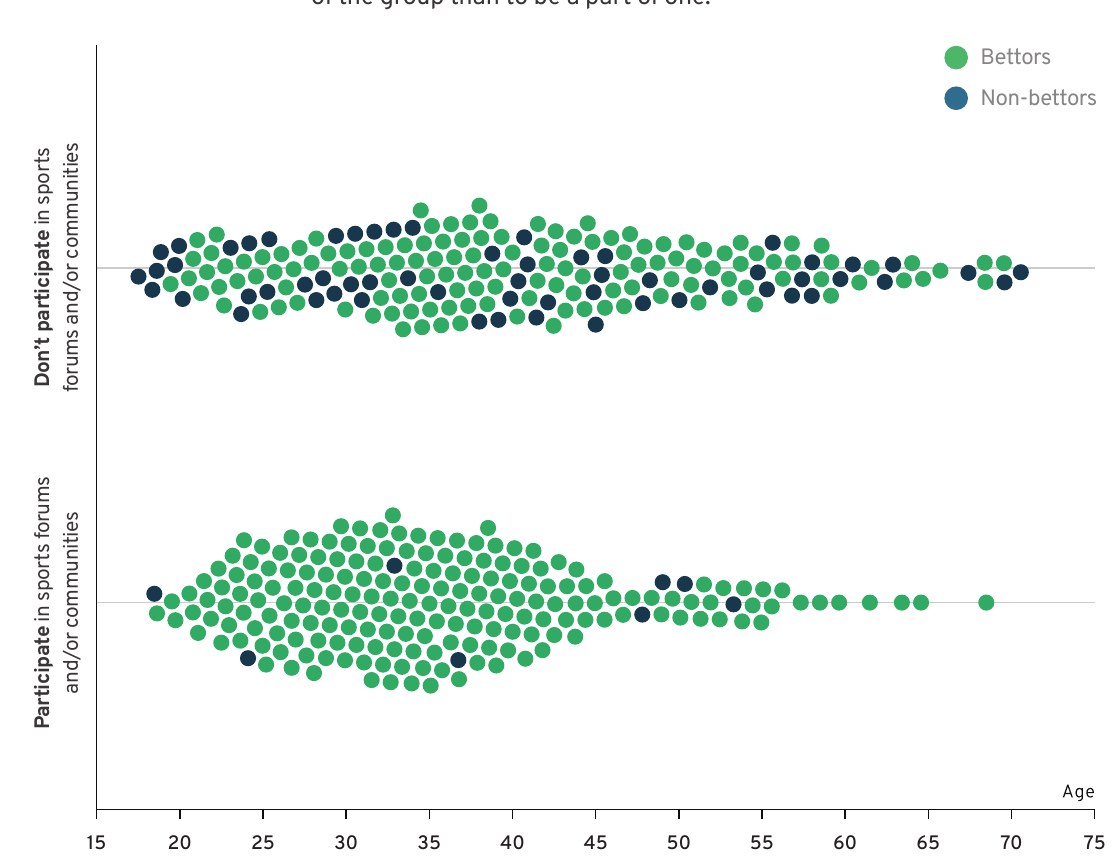
Social media is the first channel for sports content, just ahead of TV, and within it YouTube and Instagram lead. Half the audience takes part in a sports community, and the dots below show who: bettors fill the forums, non-bettors mostly stay out. Tips travel through WhatsApp and Telegram groups.
 27.99%YouTube
 25%Instagram
 17.92%Facebook
 14.05%Twitter/X
 11.39%TikTok
 2.54%Reddit
“I use WhatsApp and Telegram groups to ask questions and discuss the results.”
Sites de Apostas user, in-depth interview“I have a friend who is a great reference when it comes to betting. I follow his tips.”
Sites de Apostas user, in-depth interviewResearch every team could use, not just read.
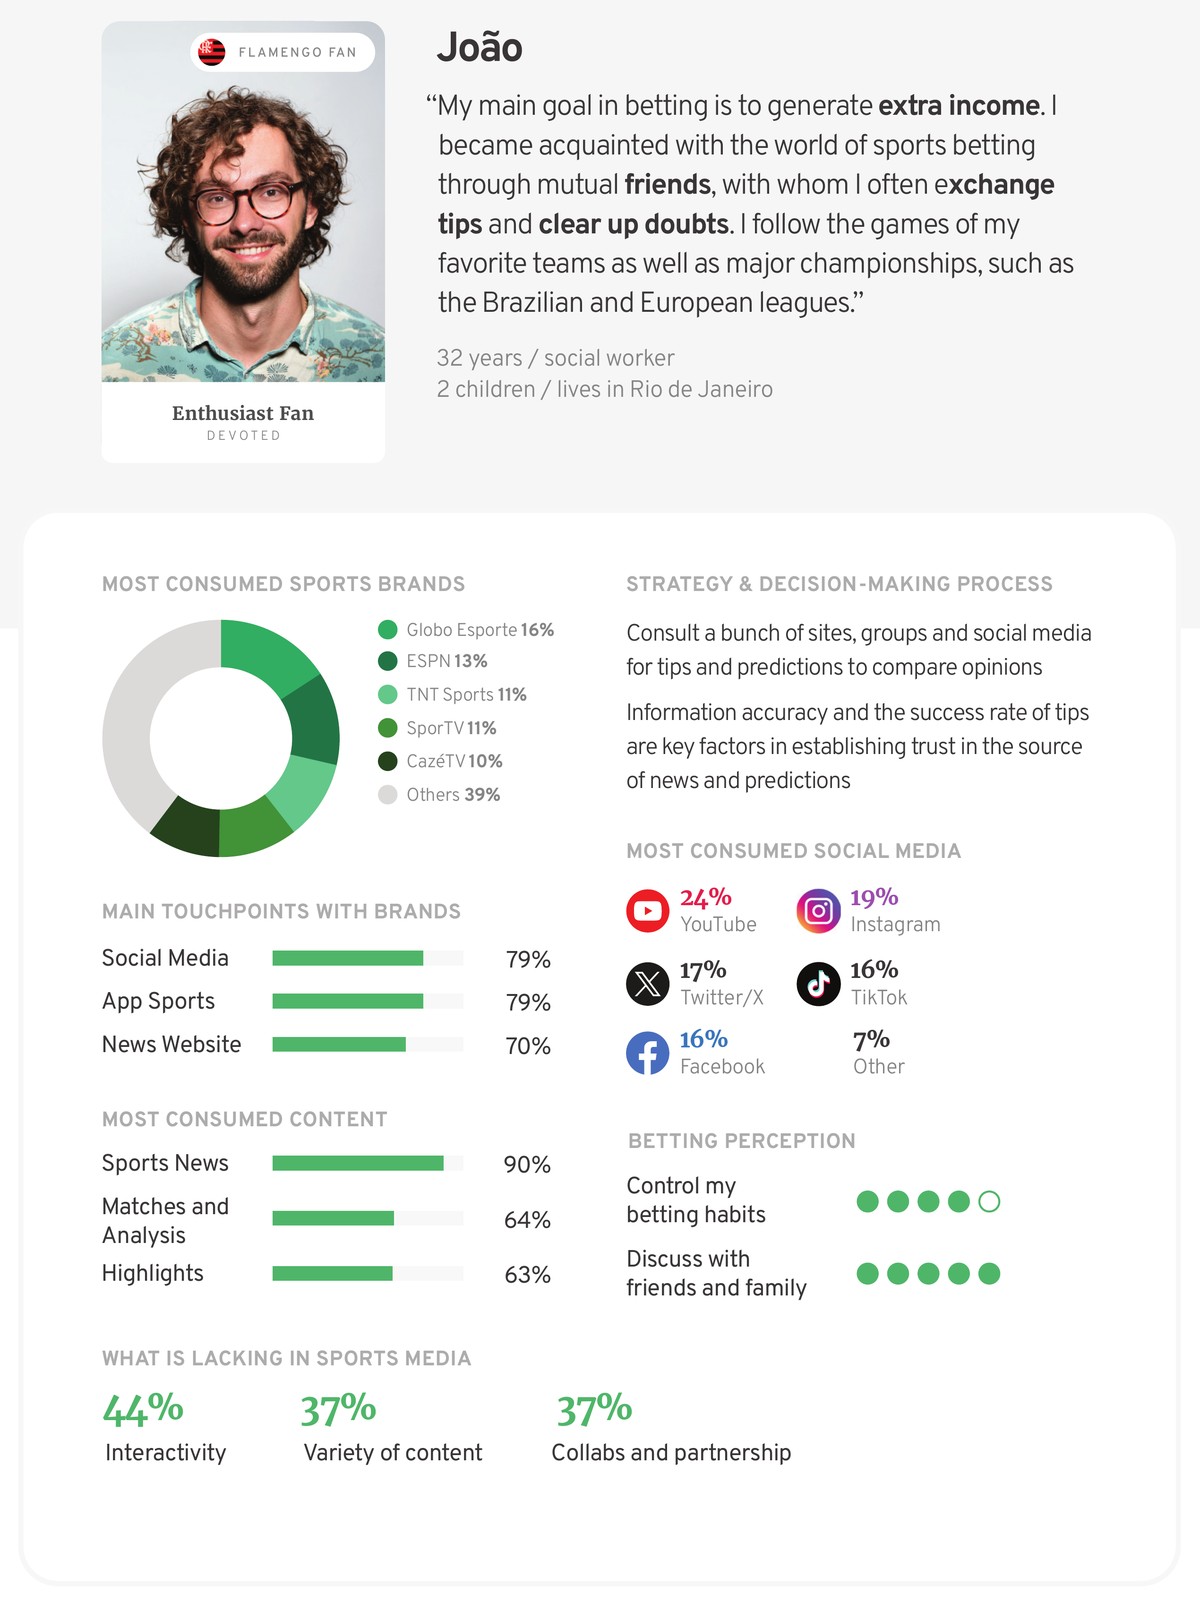
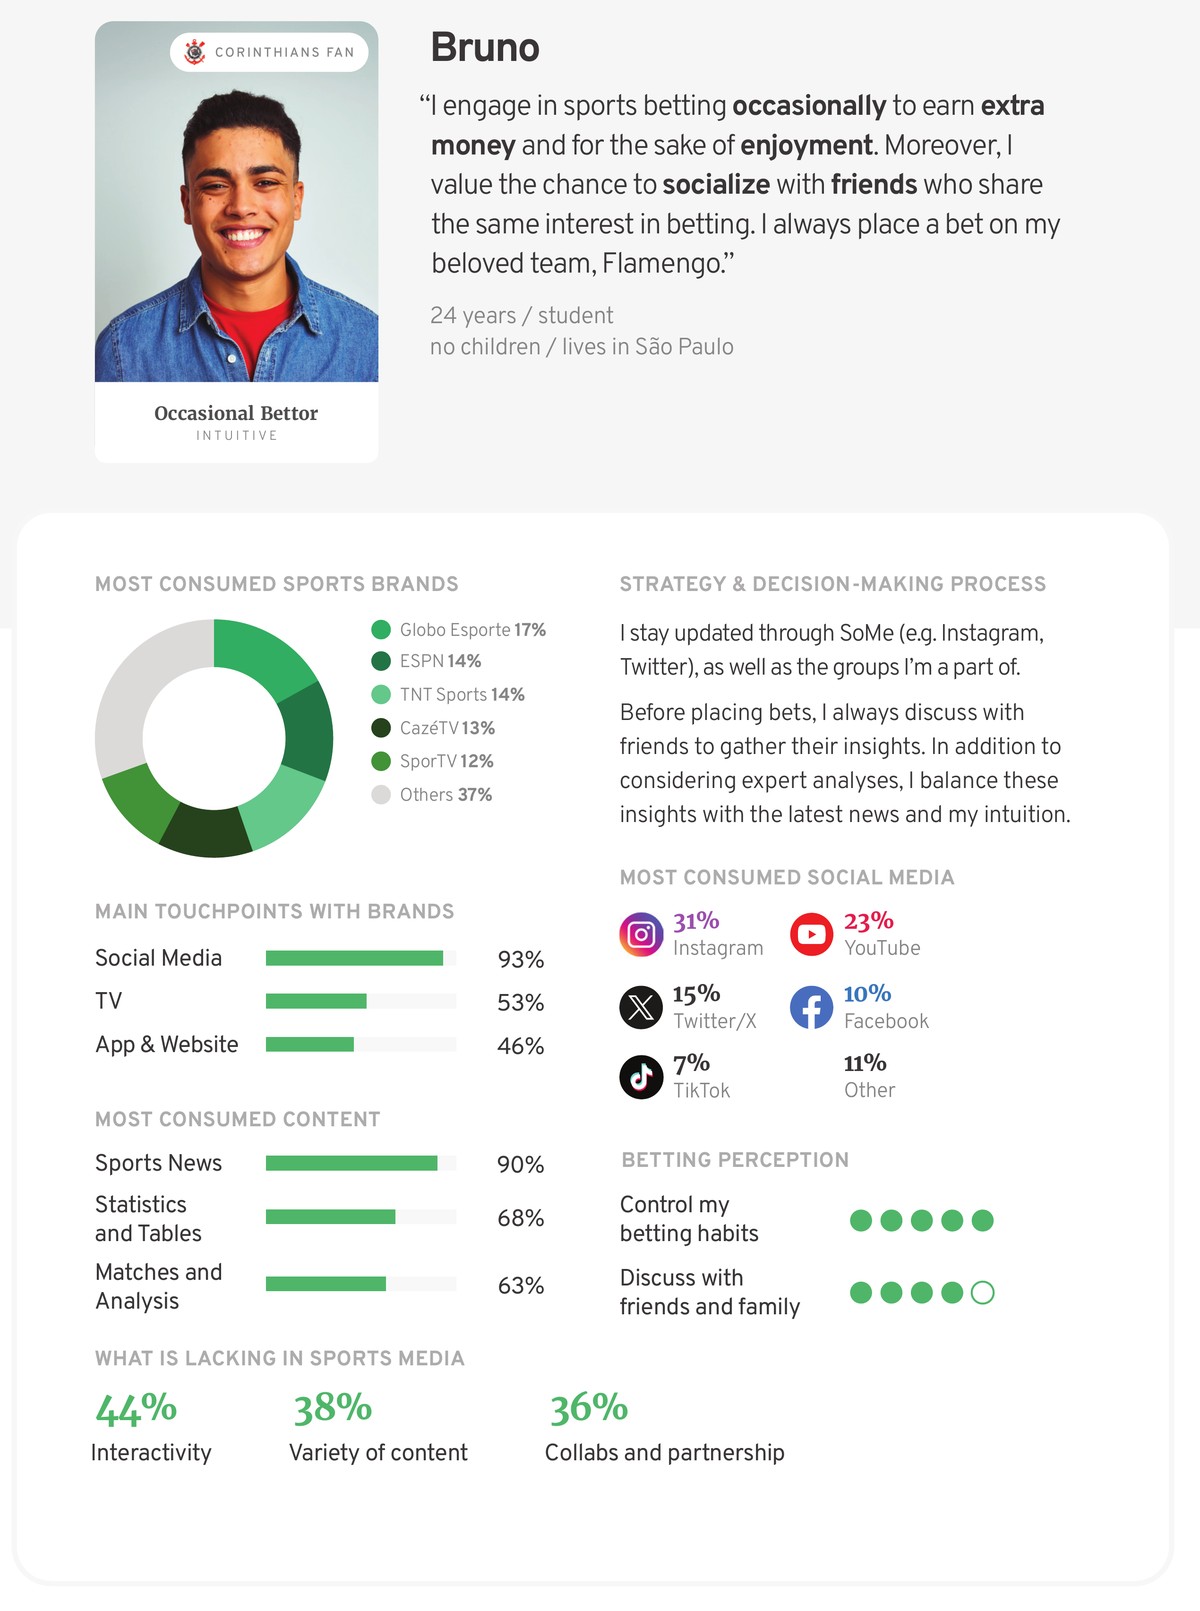
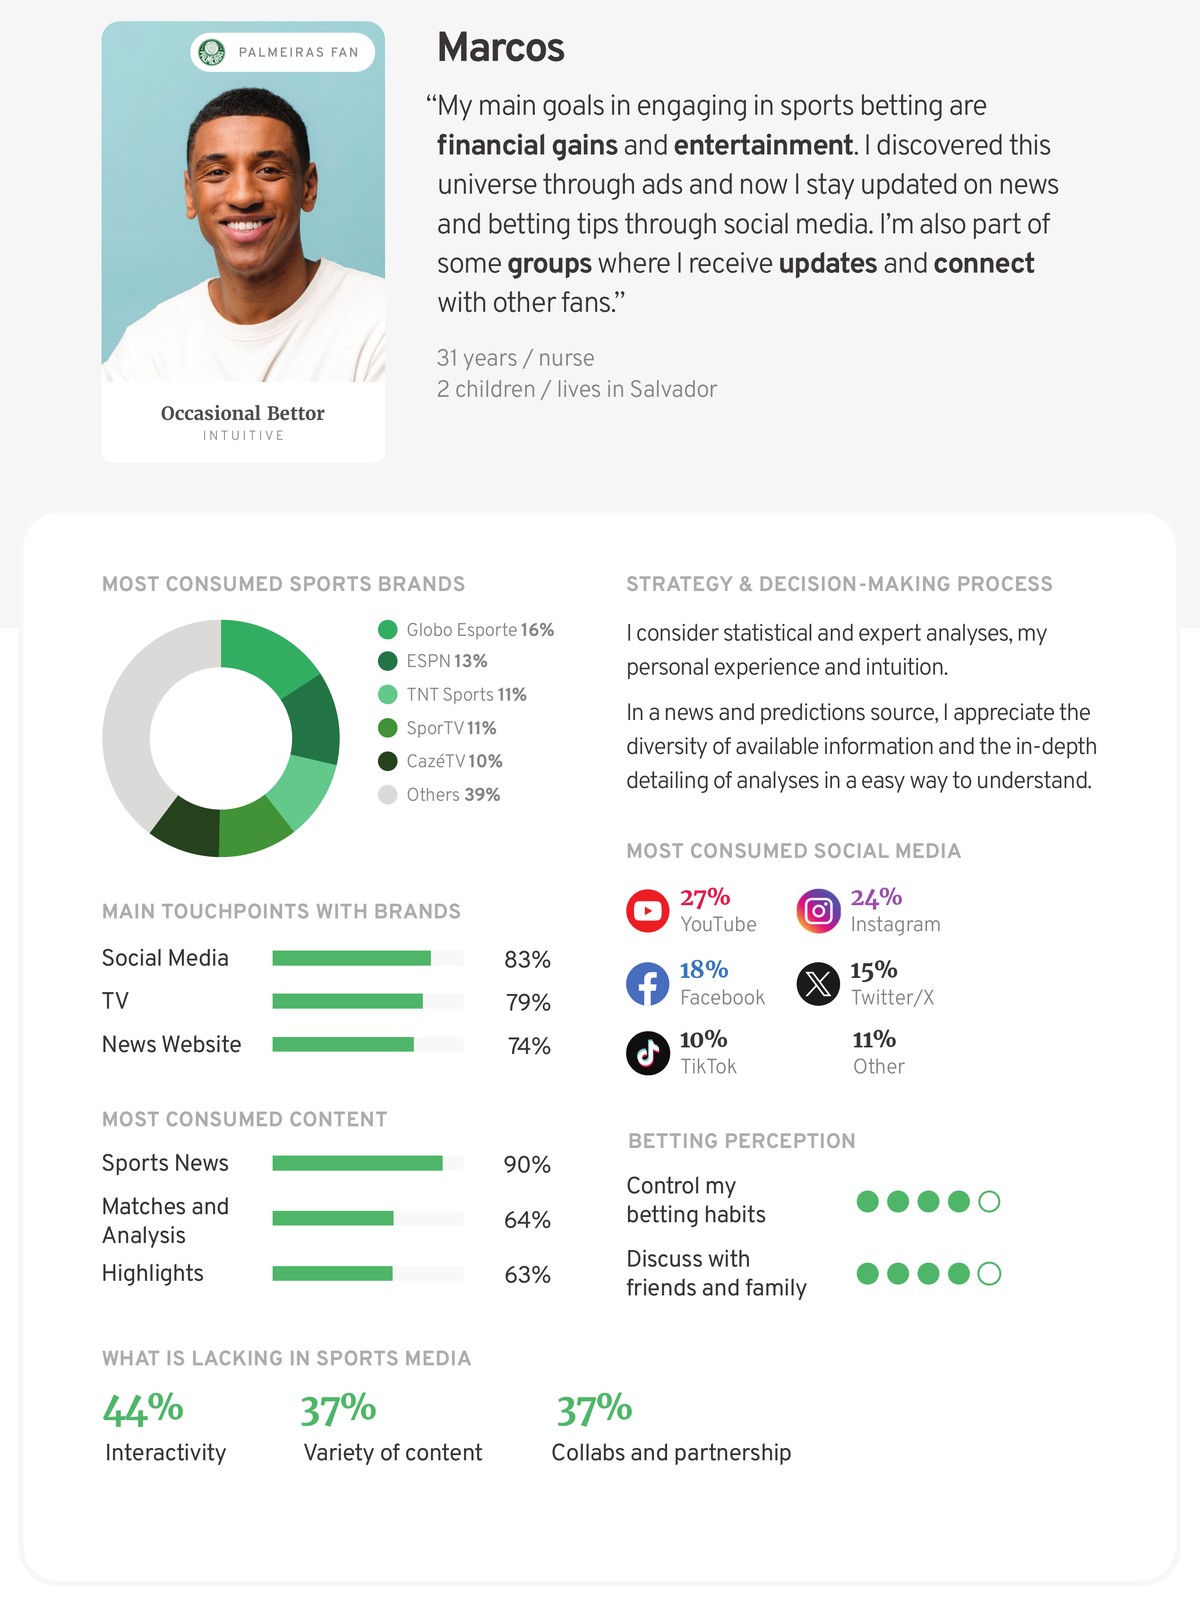
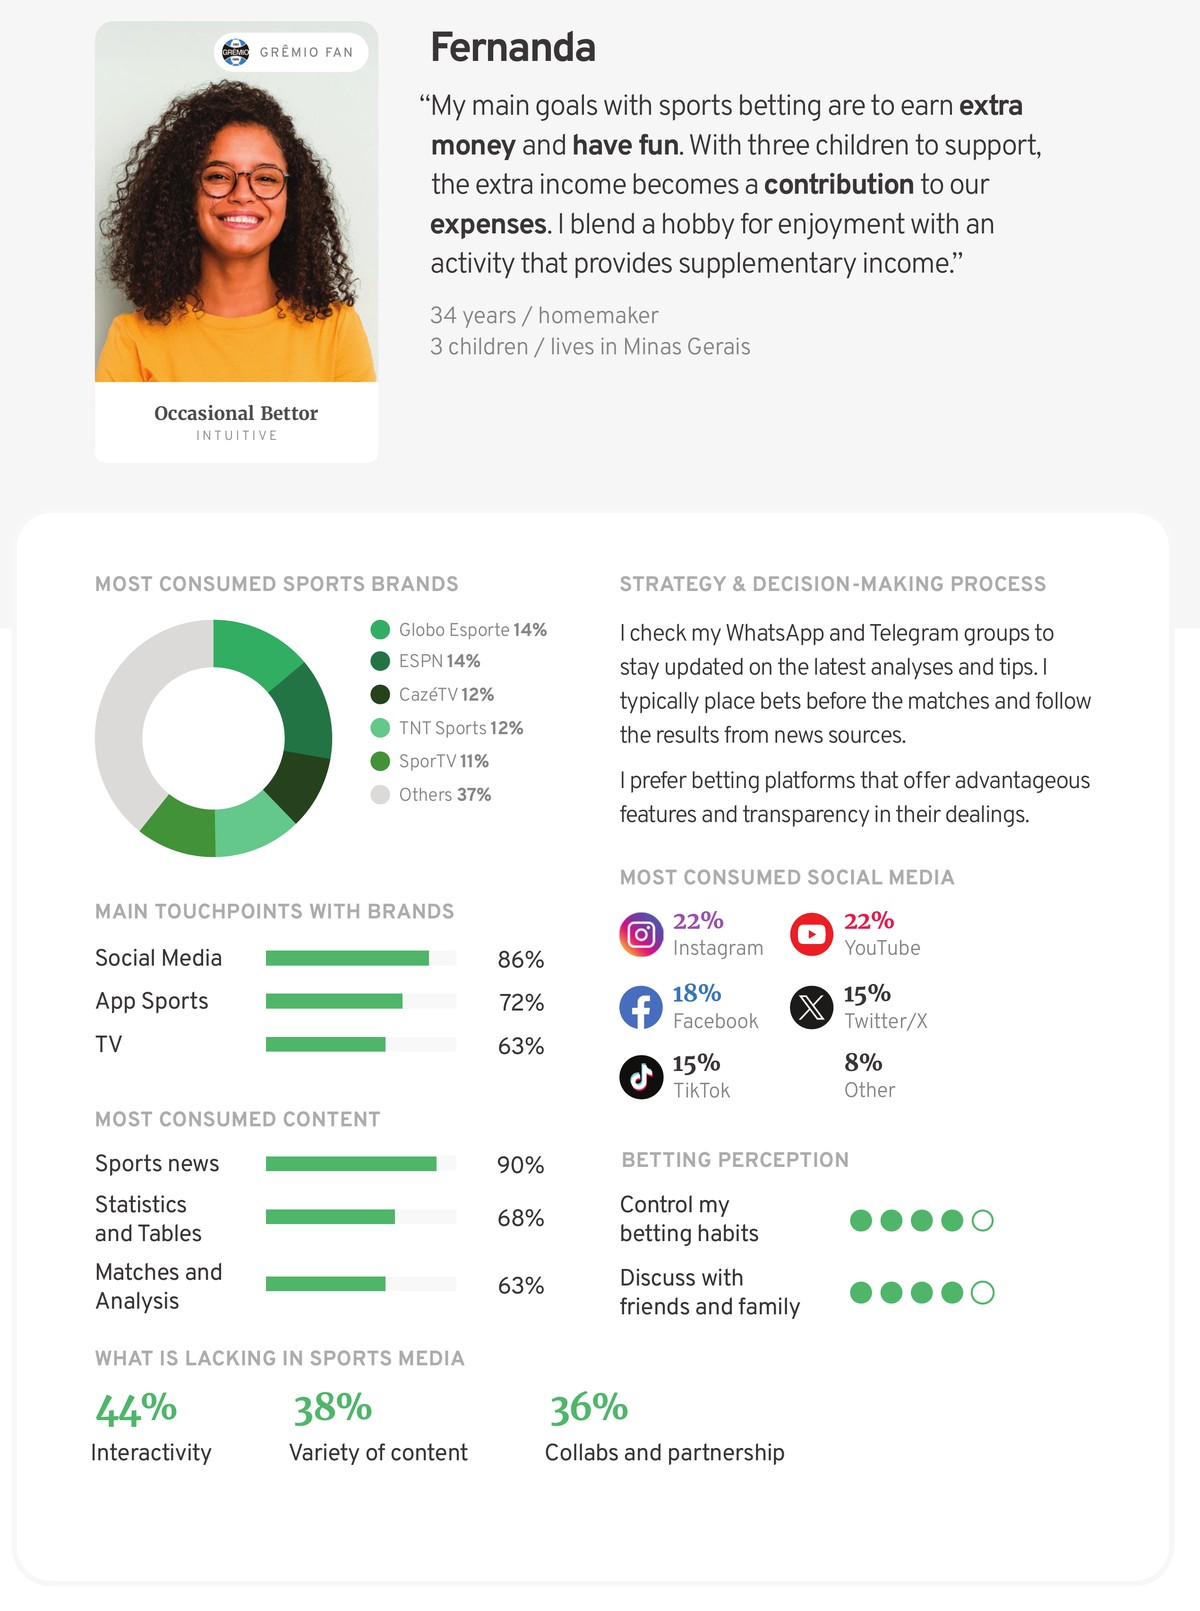
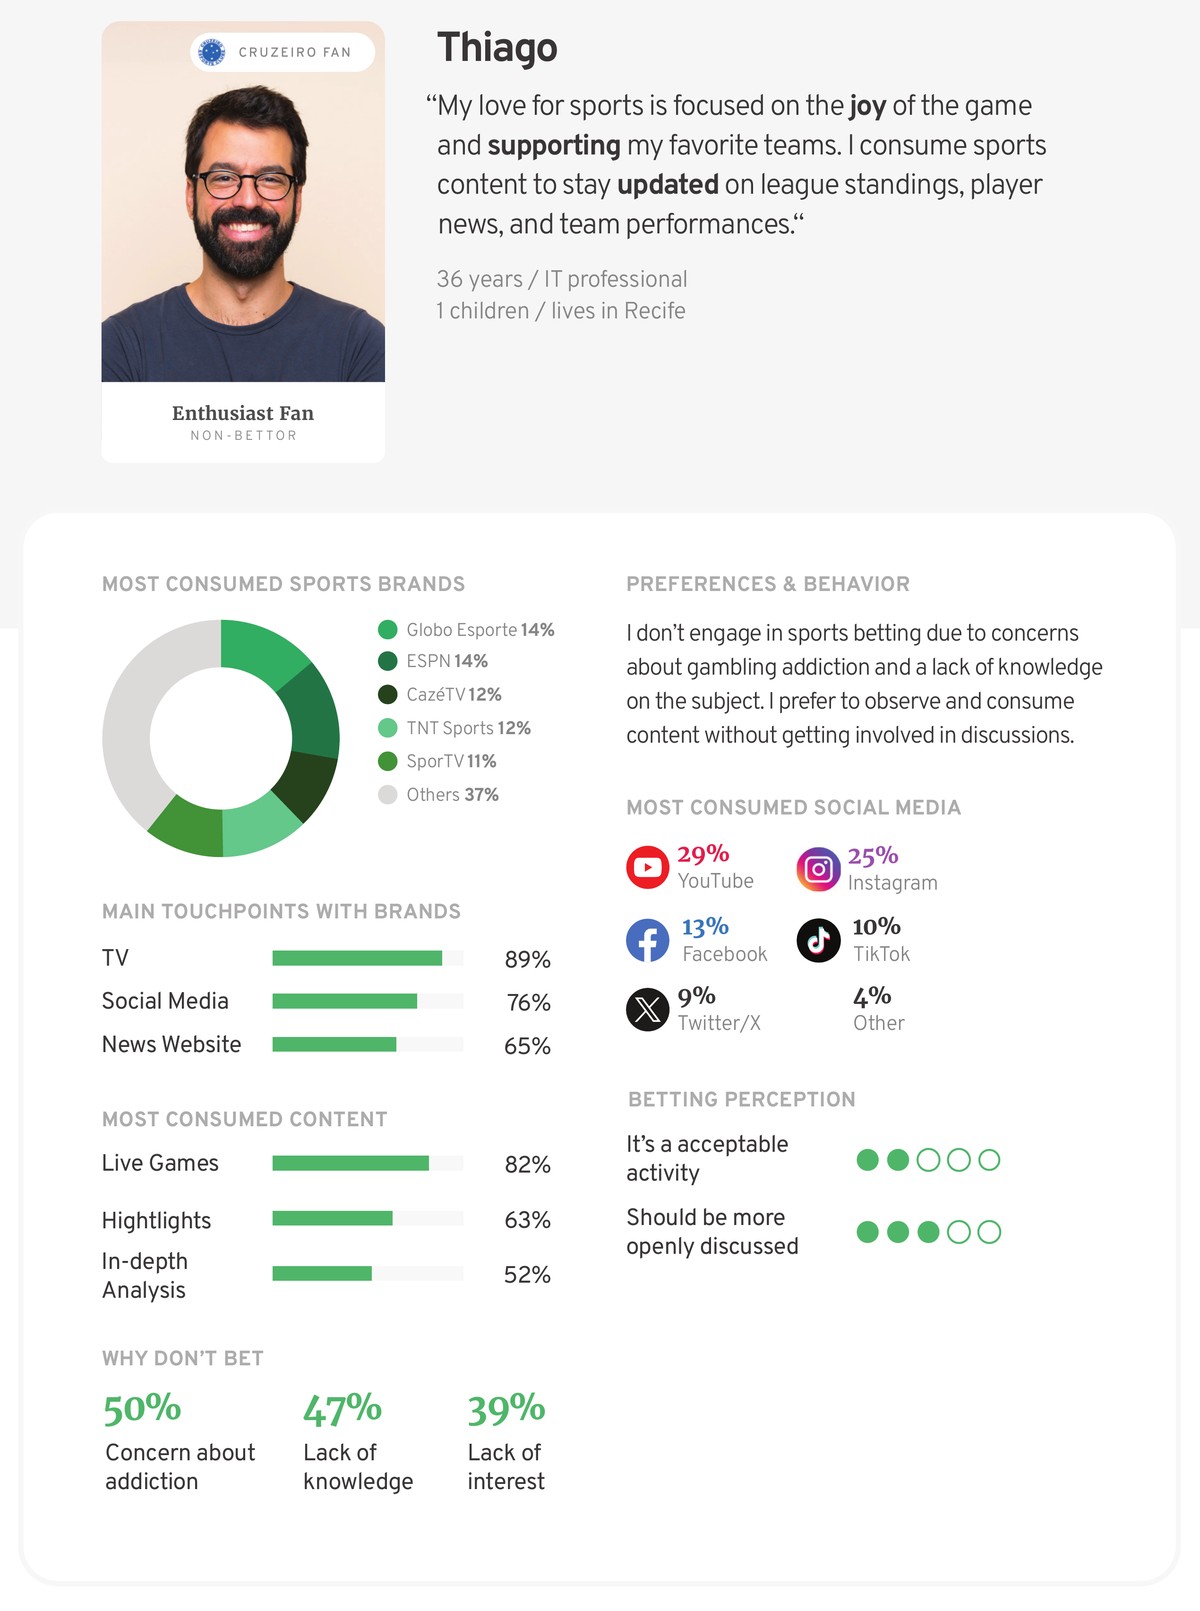
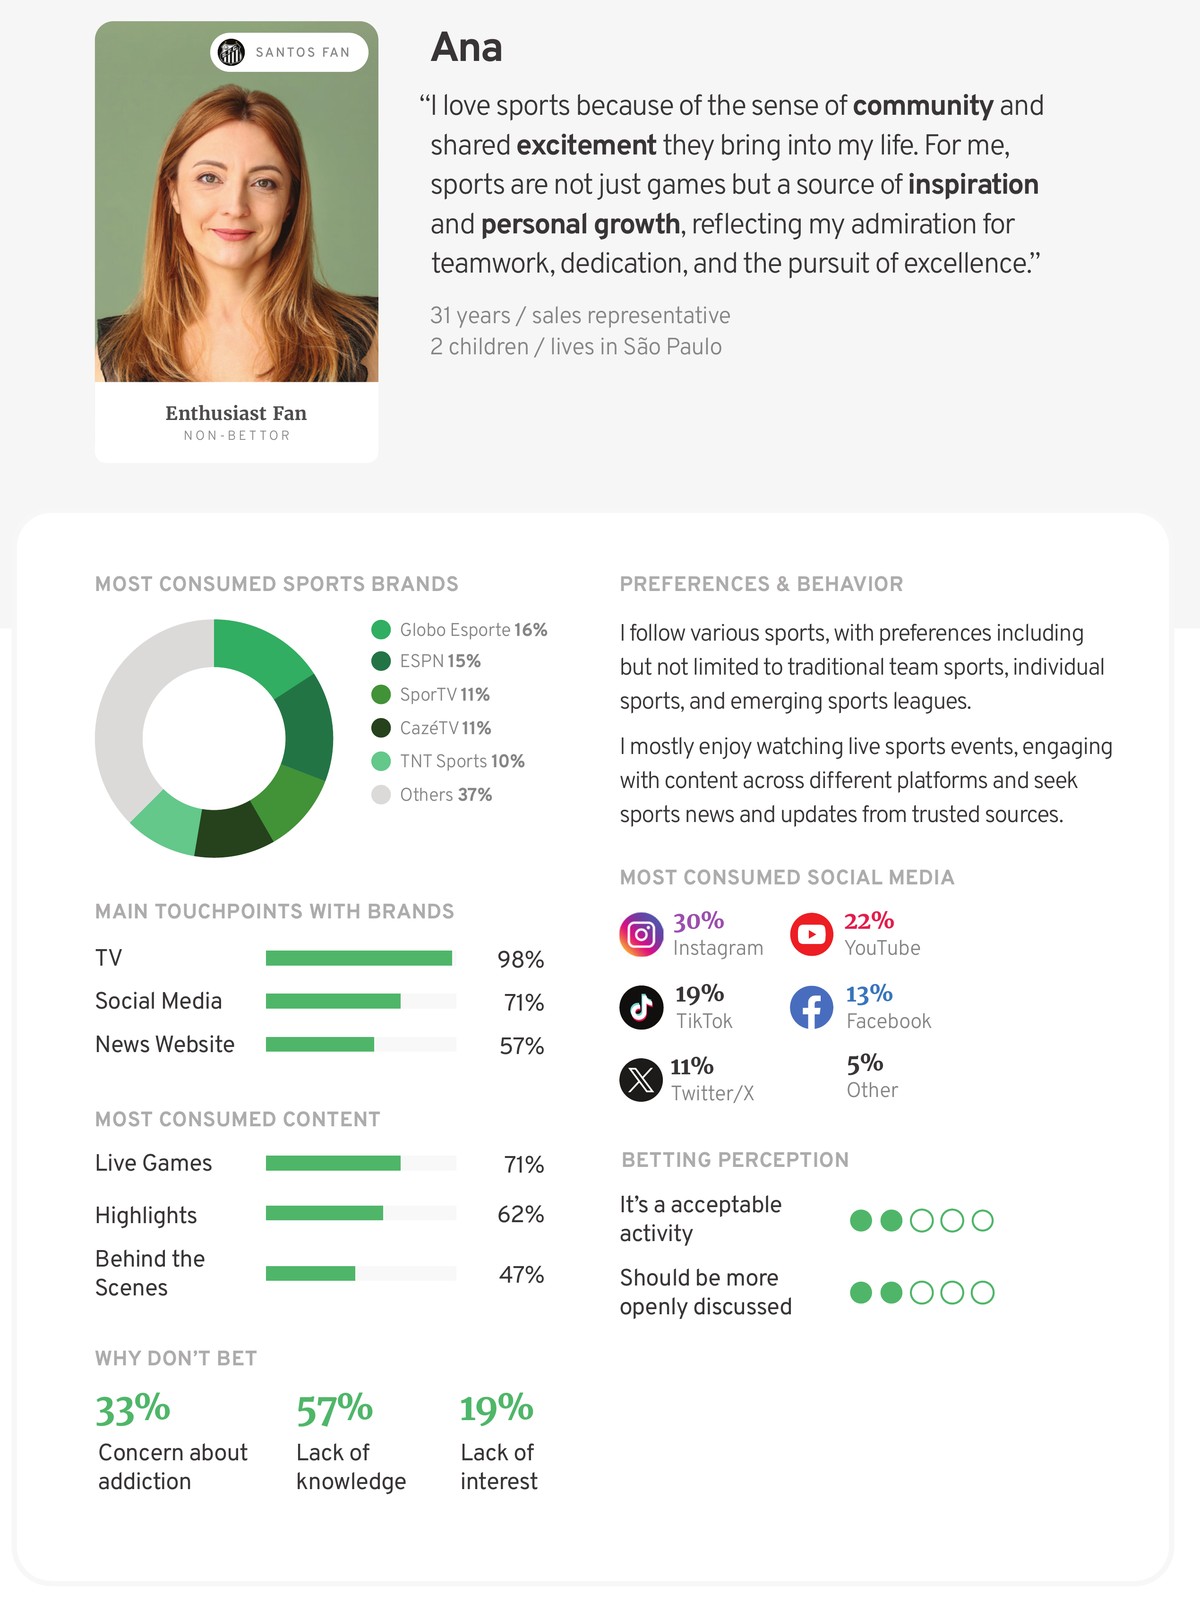
Everything came together in the 2024 Brazilian Market Research Report, built on three pillars. Its core is a segmentation of the audience into three profiles, brought to life by six data-driven personas and two user stories. Every segment and every persona comes from the survey and interview data, not from assumptions.
Audience research
Behavior, motivations and channels of Brazilian sports fans, bettors or not.
Brand awareness
Where the market’s brands and ours stand, from awareness to preference.
User segmentation
Segments, personas and user stories that make the audience tangible.
Everyday Bettor
“I view betting as a serious and analytical endeavor.”
Occasional Bettor
“My goal within betting is to make some extra cash as a hobby.”
Enthusiastic Fan
“Since my childhood days, sports have held a significant place in my life.”
Adopted across the company, and used to make real decisions.
The report was released across the company and presented internally. Marketing, content and product teams adopted it as their shared picture of the Brazilian audience.
approval rating for the report, adopted by teams in every area of the company.
Marketing planned campaigns aimed at the audience segments defined in the report.
The findings fed directly into which features product teams prioritized.
It closed with four opportunities for the Brazilian brands:
Teach, don’t just promote
Half of non-betting fans don’t bet because they don’t understand it. Educational content on how betting and bookmakers work lowers that barrier.
Win on quality, not reach
Fans prefer the brands with local relevance, exclusive coverage and in-depth analysis, whatever their overall recognition.
Build community, not only reach
Half the audience is part of a sports community, mostly bettors. Engagement is what turns awareness into loyalty.
Go where fans already are
YouTube and Instagram lead sports news consumption. Platform-native content beats repurposed articles.

“Gabriel’s deliverables were of exceptionally high quality.”
Gabriel joined our UX Research team, gaining insights crucial to our product development efforts. Focusing primarily on the Brazilian market, he excelled in mapping out sports and betting profiles and gathering comprehensive market insights. He also covered other South American countries and contributed to our US product team by conducting surveys and interviews. Gabriel’s deliverables were of exceptionally high quality, offering valuable input to both product teams and business units for strategic decision-making. I highly recommend Gabriel for any product team.
What I take from it.
Research is a team sport
Sharing a common vocabulary with marketing, content and product teams mattered as much as the data itself.
Data is only useful if people can find it
With this much data, a structured, open repository is what lets the company keep deciding with it.
None of this is set in stone
Media habits and platforms change fast. Research like this has to be continuous, not a one-off.