Revuze’s consumer-intelligence hub had the data brand teams needed, but people couldn’t find it or make sense of it. I restructured the navigation and rebuilt the product page so every screen answers one clear question.
- Company
- Revuze
- Year
- 2026
- Role
- Product Designer, the only one dedicated to the project
- Scope
- IA, UX/UI, AI states, design system
Revuze reads millions of reviews so brands don’t have to.
A B2B consumer-intelligence platform powered by AI. Product 360° is its main hub: everything shoppers say about a product, how it performs in its category and where it stands against competitors.
Clients signed up, looked around once and didn’t come back.
Retention after the first month was low, sessions were spent navigating instead of reading data, and the deeper pages (Health score, Motivations, Customer care) were barely used.
“I don’t know where to find things.”
Findability“I thought you didn’t have that data.”
Hidden value“To check another product, I have to leave the page and start over.”
Switching products“I keep seeing the same numbers on different pages.”
Repetition“Open a tab, close a tab, open another one…”
Context switchingNone of them asked for more data. They asked to understand the data they already had.
Paraphrased from client feedback sessions and account-manager notes.
A menu that hid its most valuable pages
The sidebar opened on hover, right on top of the data, and kept key pages in a second level that many users never knew existed.
Three clicks to reach a product
Open the menu, go to Product 360°, pick a product on its own page and press Discover. To switch, start over.
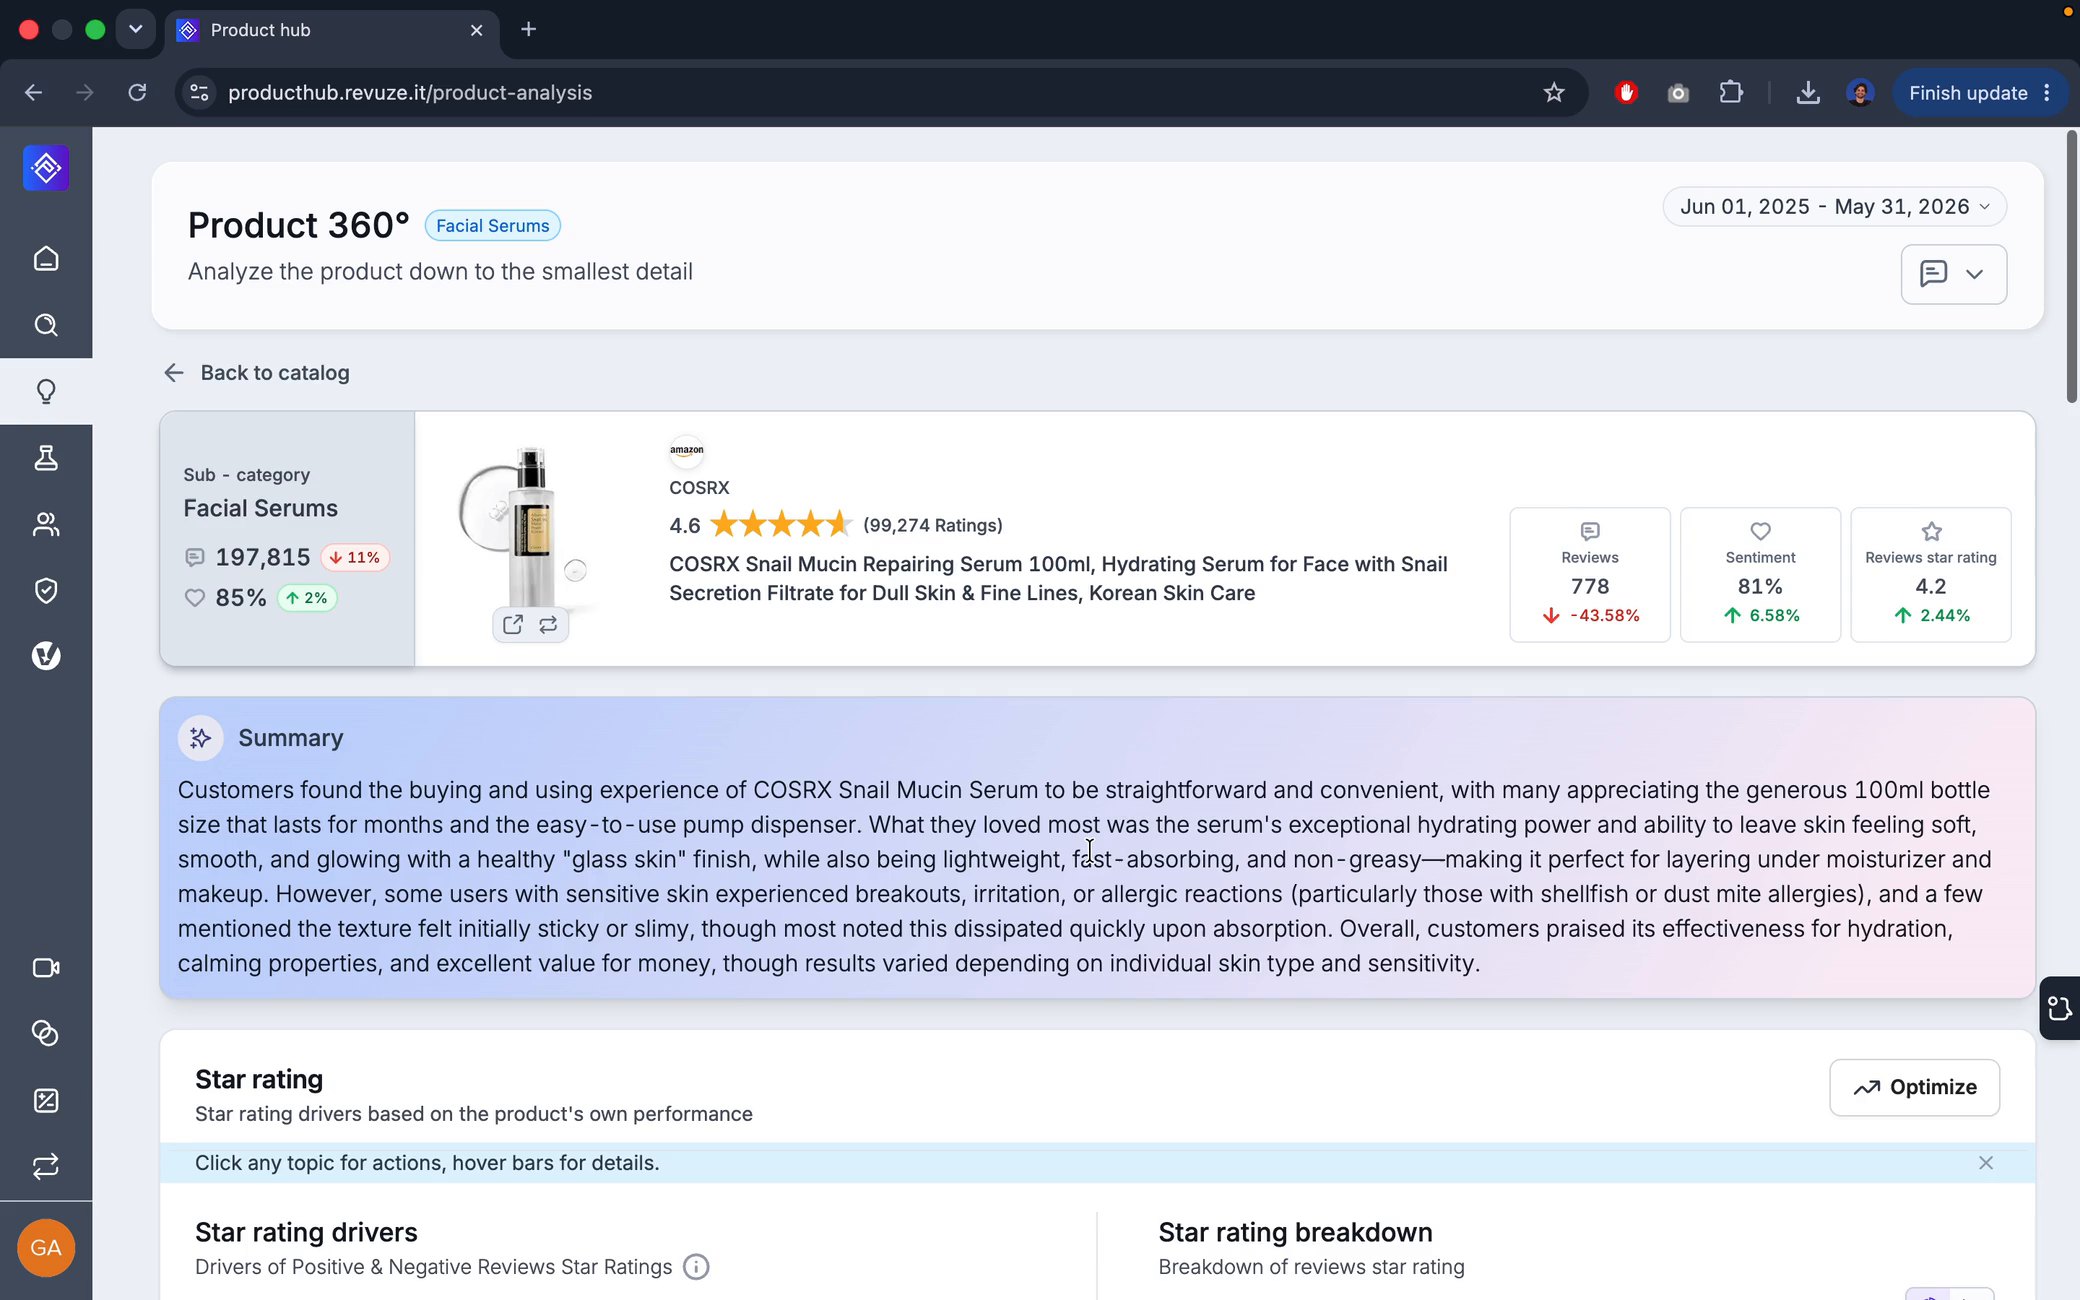
A first fold with little value
The header took about half the screen and a long AI summary filled the rest. Nothing up there helped you decide anything.
No storytelling
Blocks stacked one after another, with no clear reason for being there.
If every screen answered a clear question, and the path to it was obvious, people would come back.
Fewer, clearer places to go, named the way users think.
Each block leads with the question it answers.
Explain the AI numbers, and say so when data is missing.
Explore the structure, rethink the taxonomy, rewrite the story.
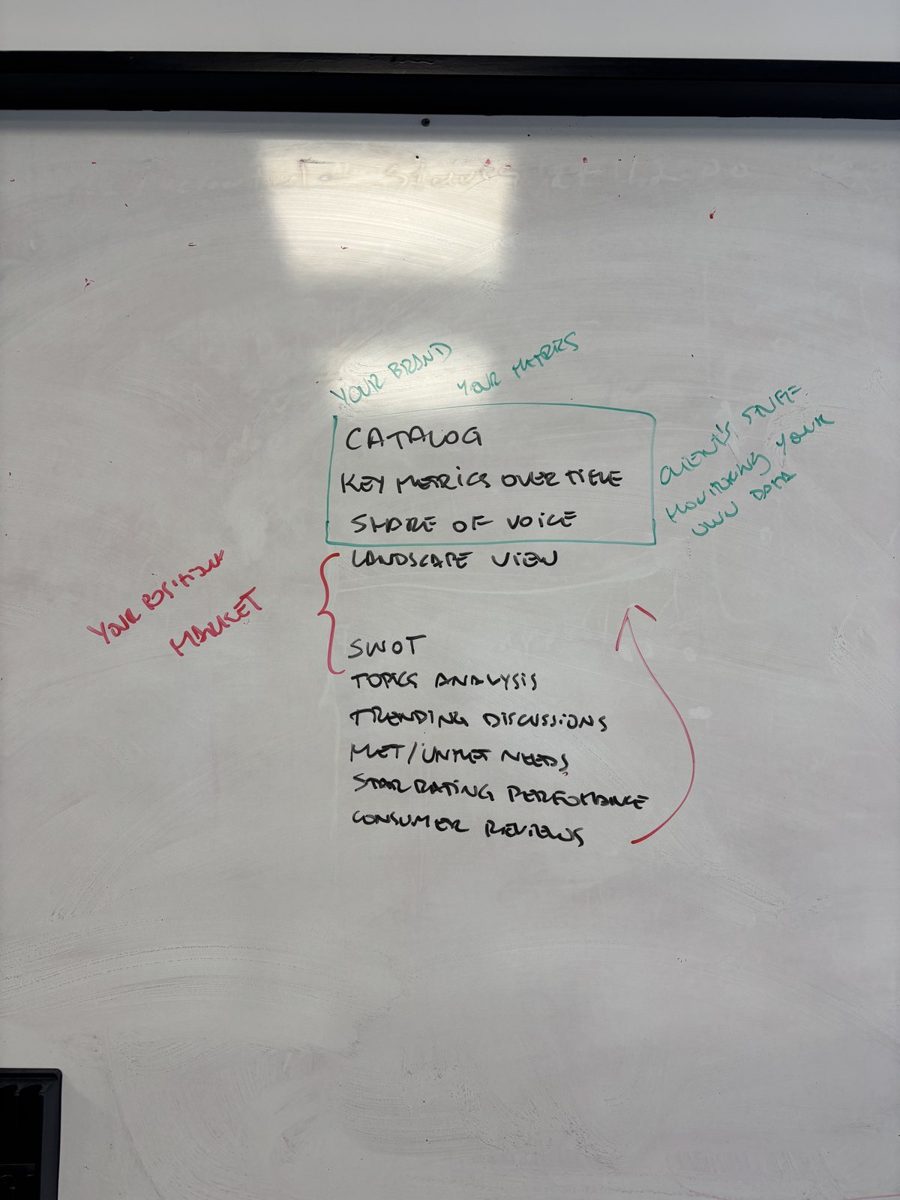
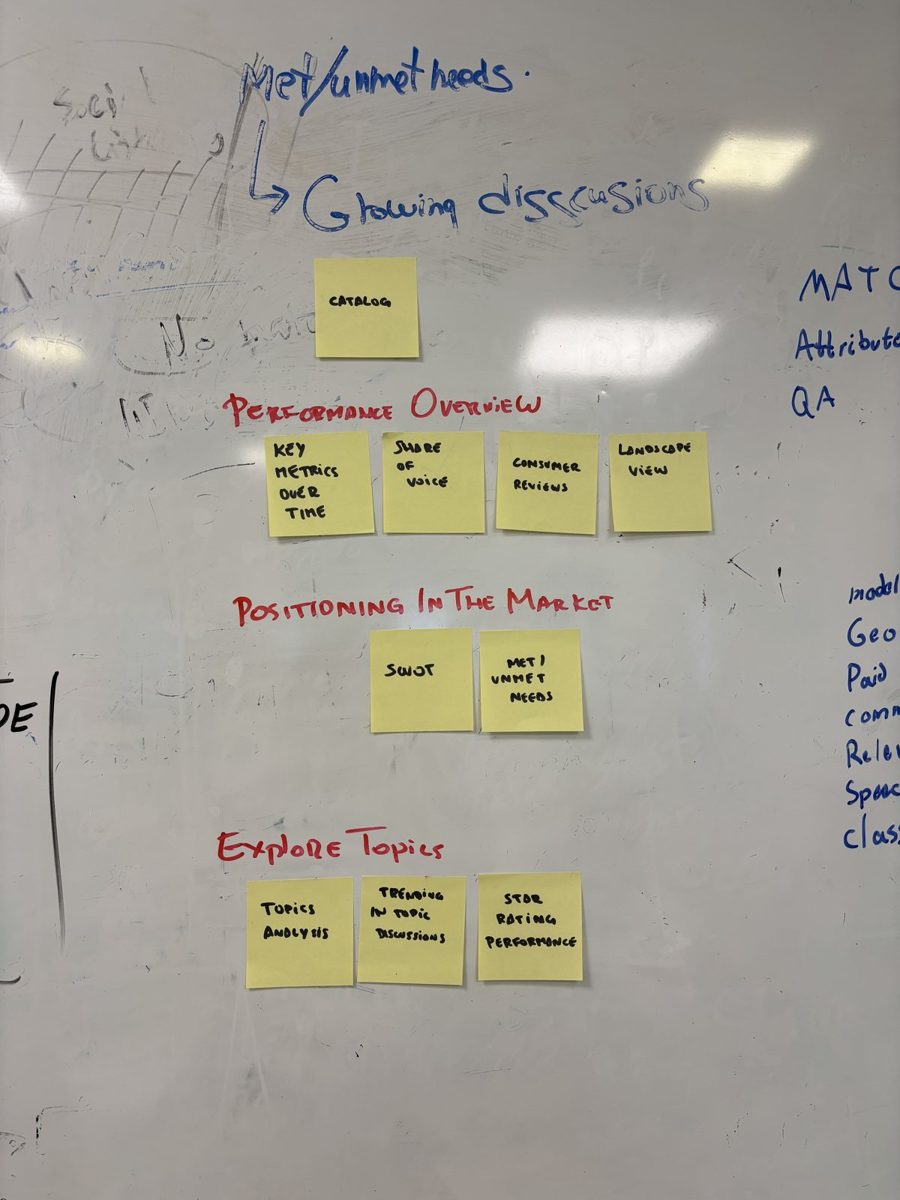
I ran the structure work with the people closest to the users: PMs, Customer Support, developers, QA and one other product designer. From there, sketches, explorations with Claude and high fidelity.
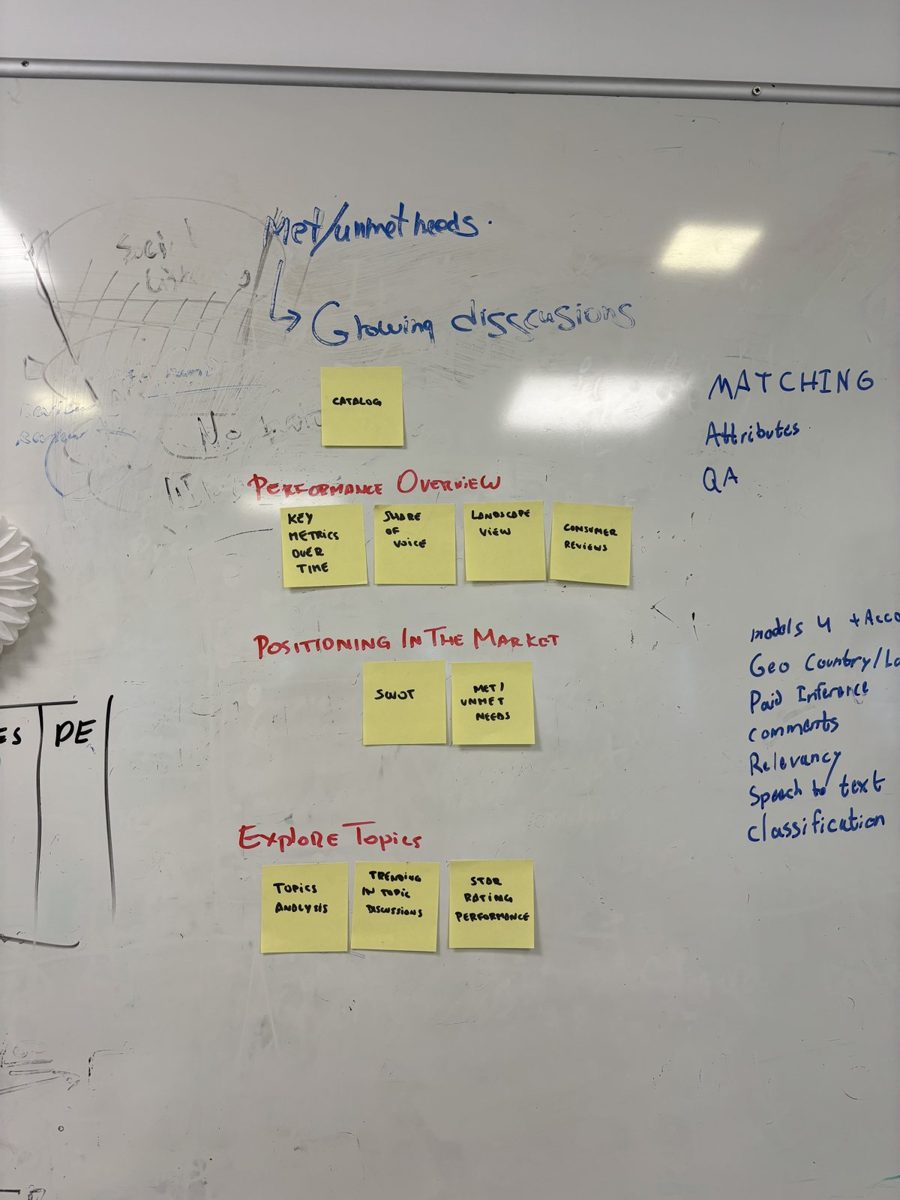
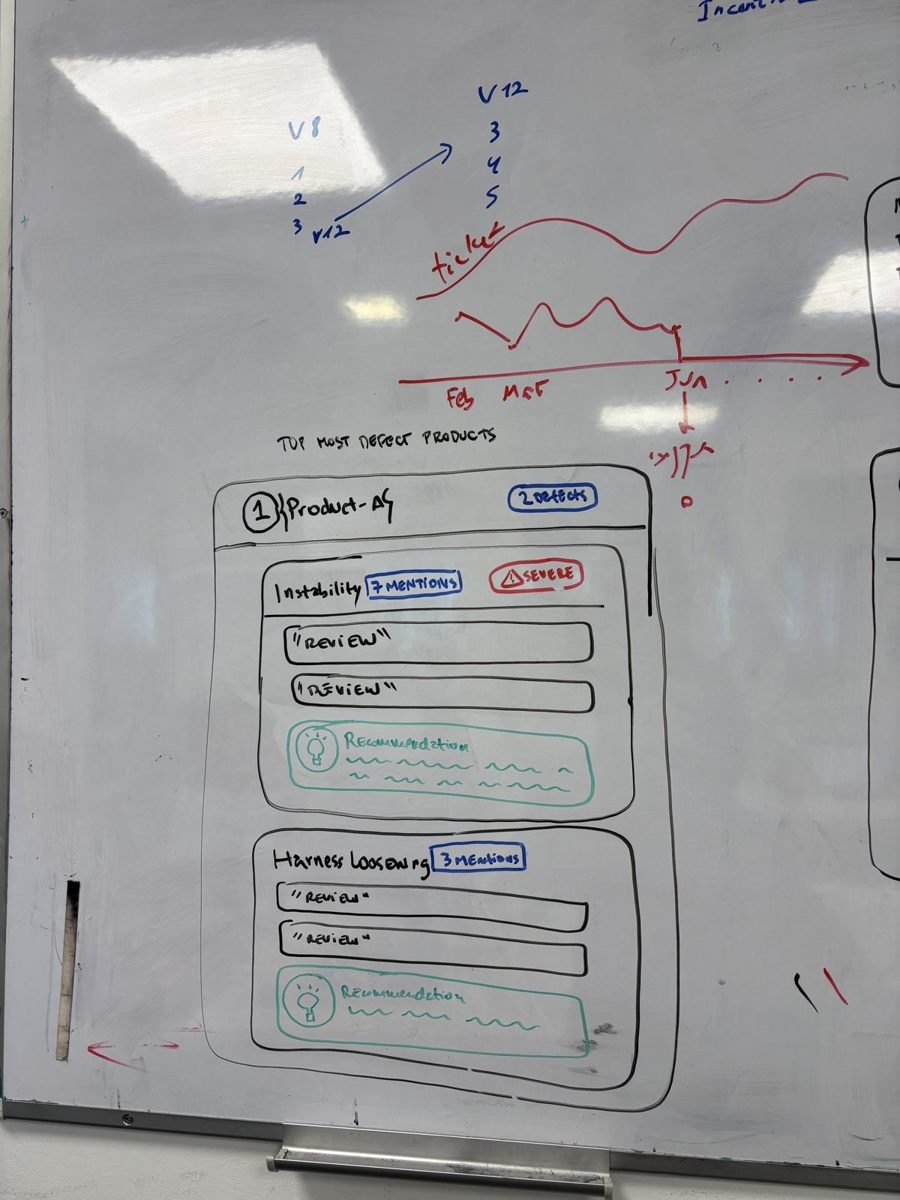
On the whiteboard
The real sessions at the office: sticky notes, regrouping and the consolidated groups that became the new menu.
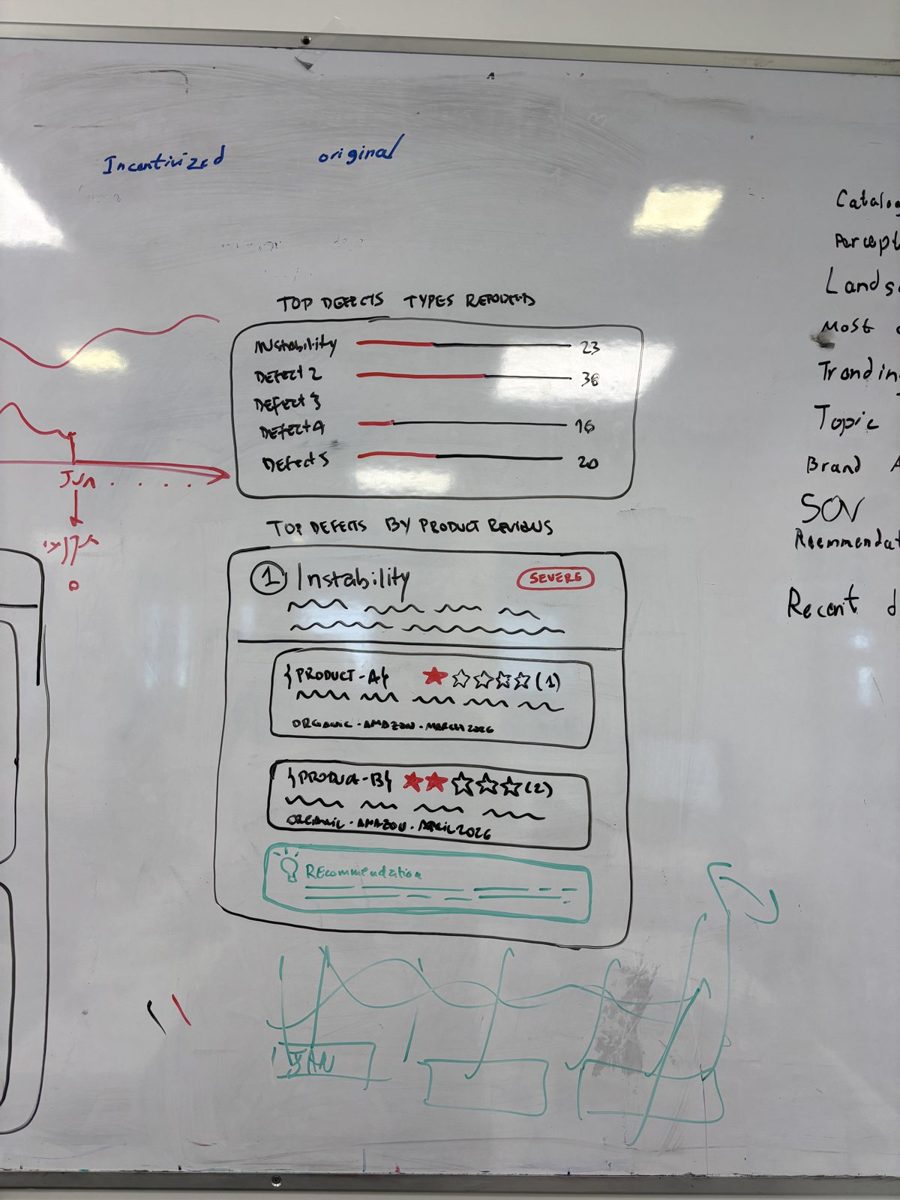
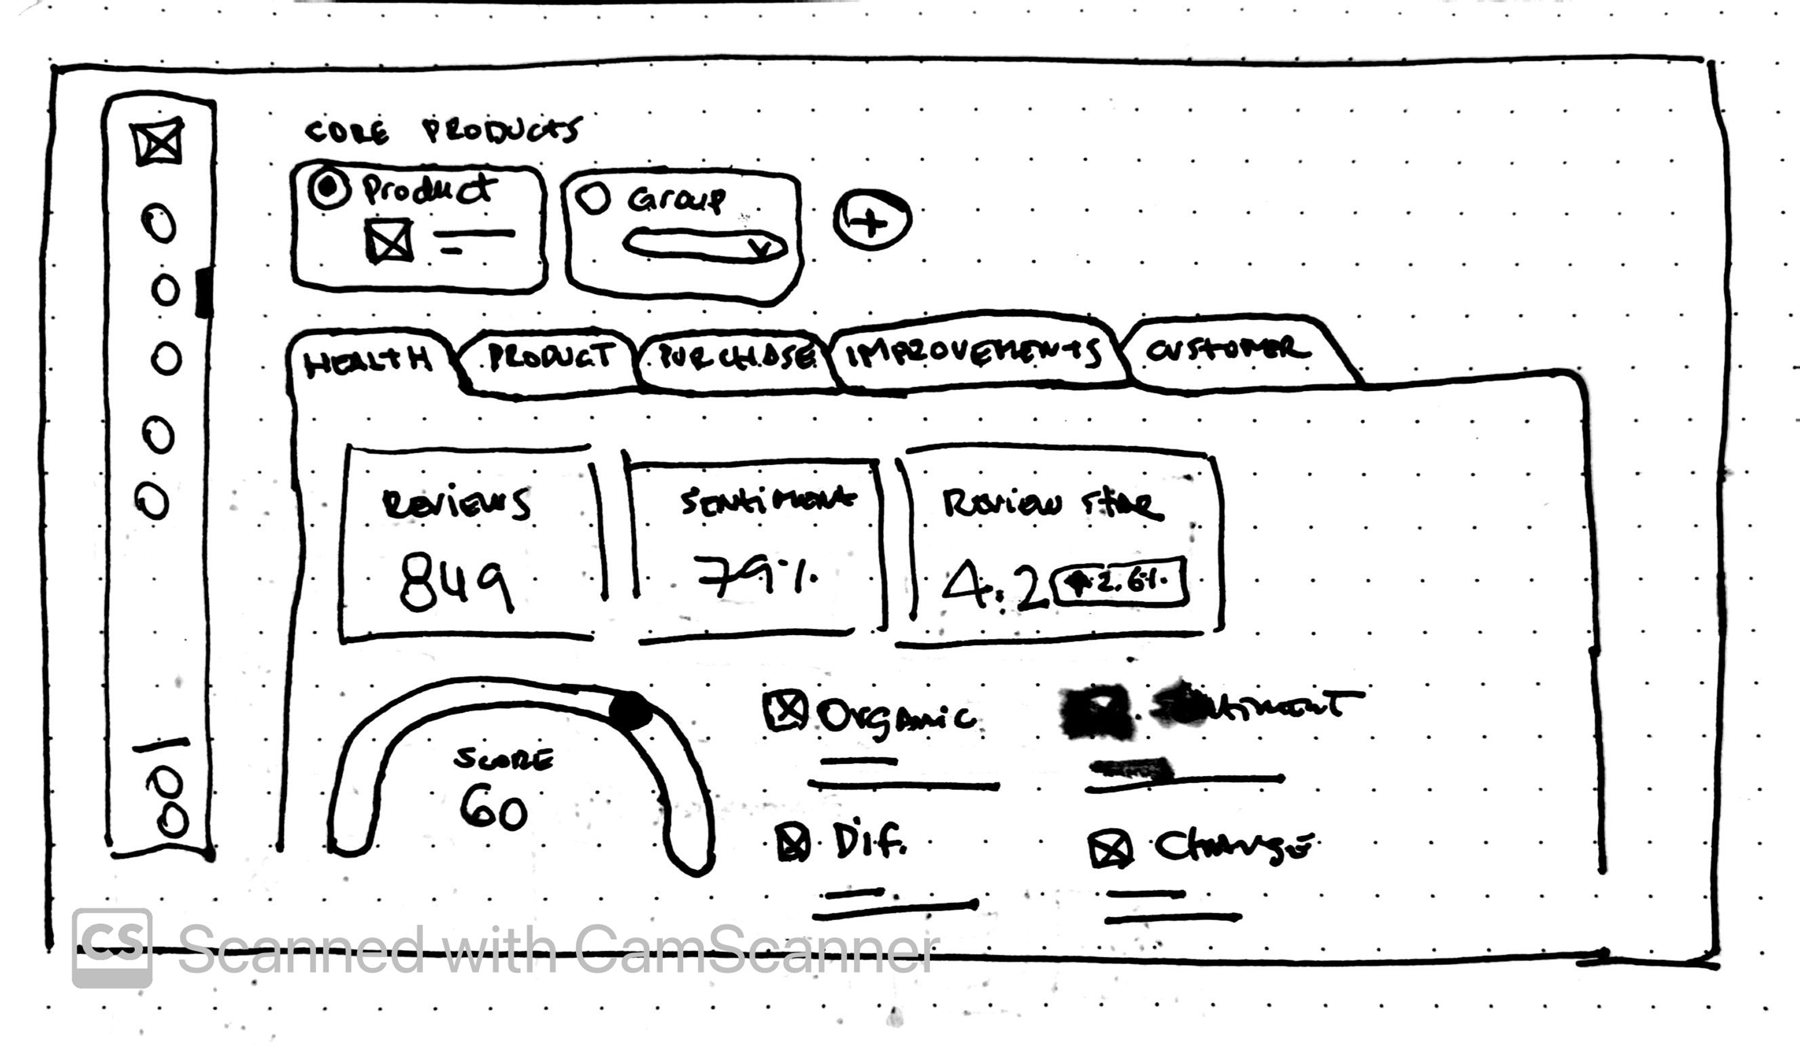
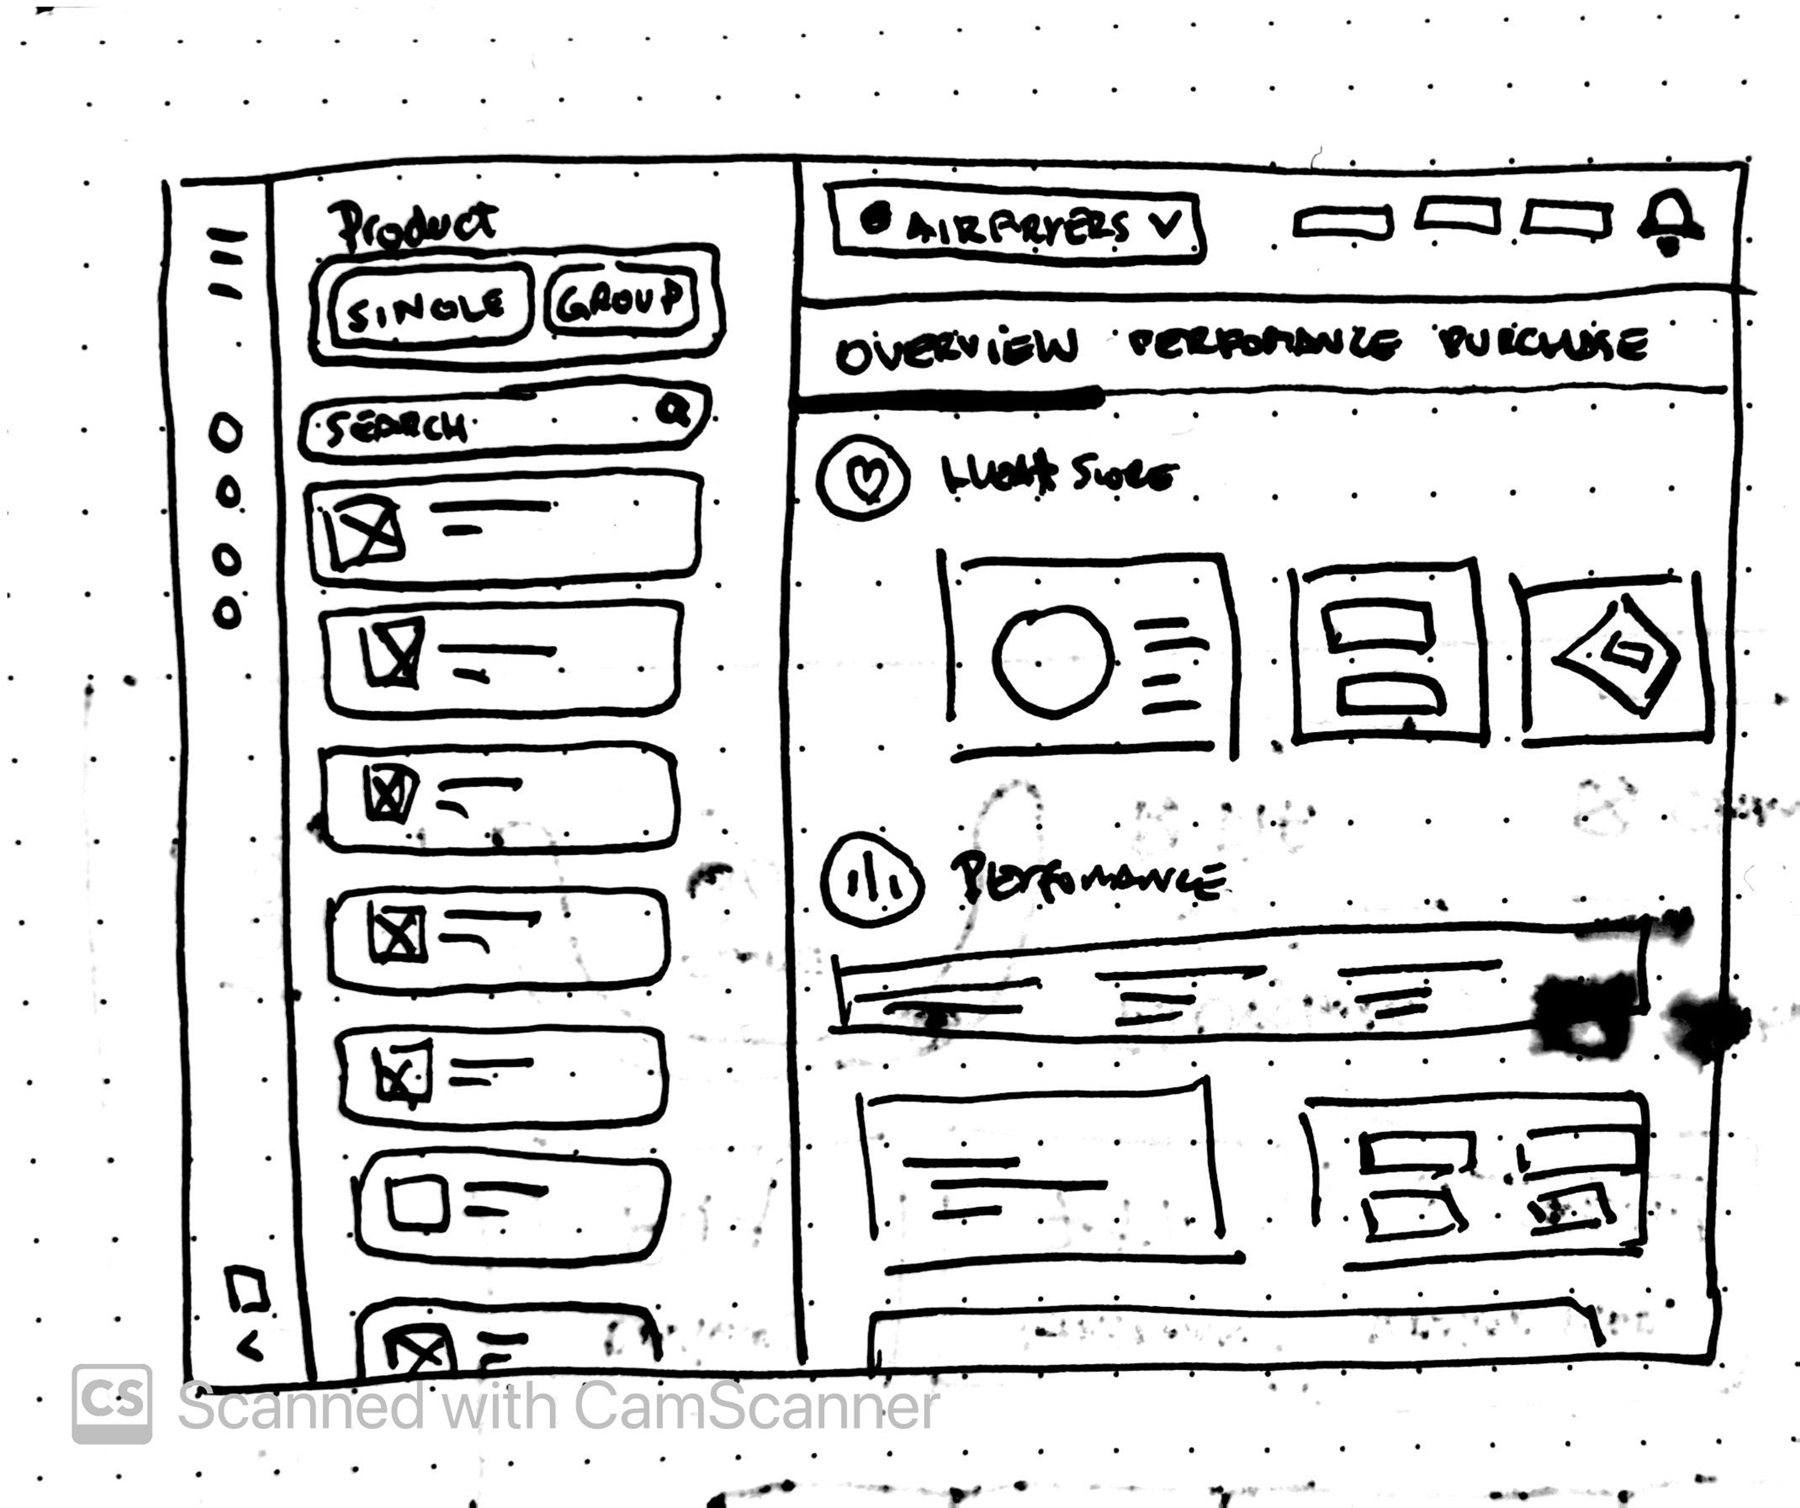
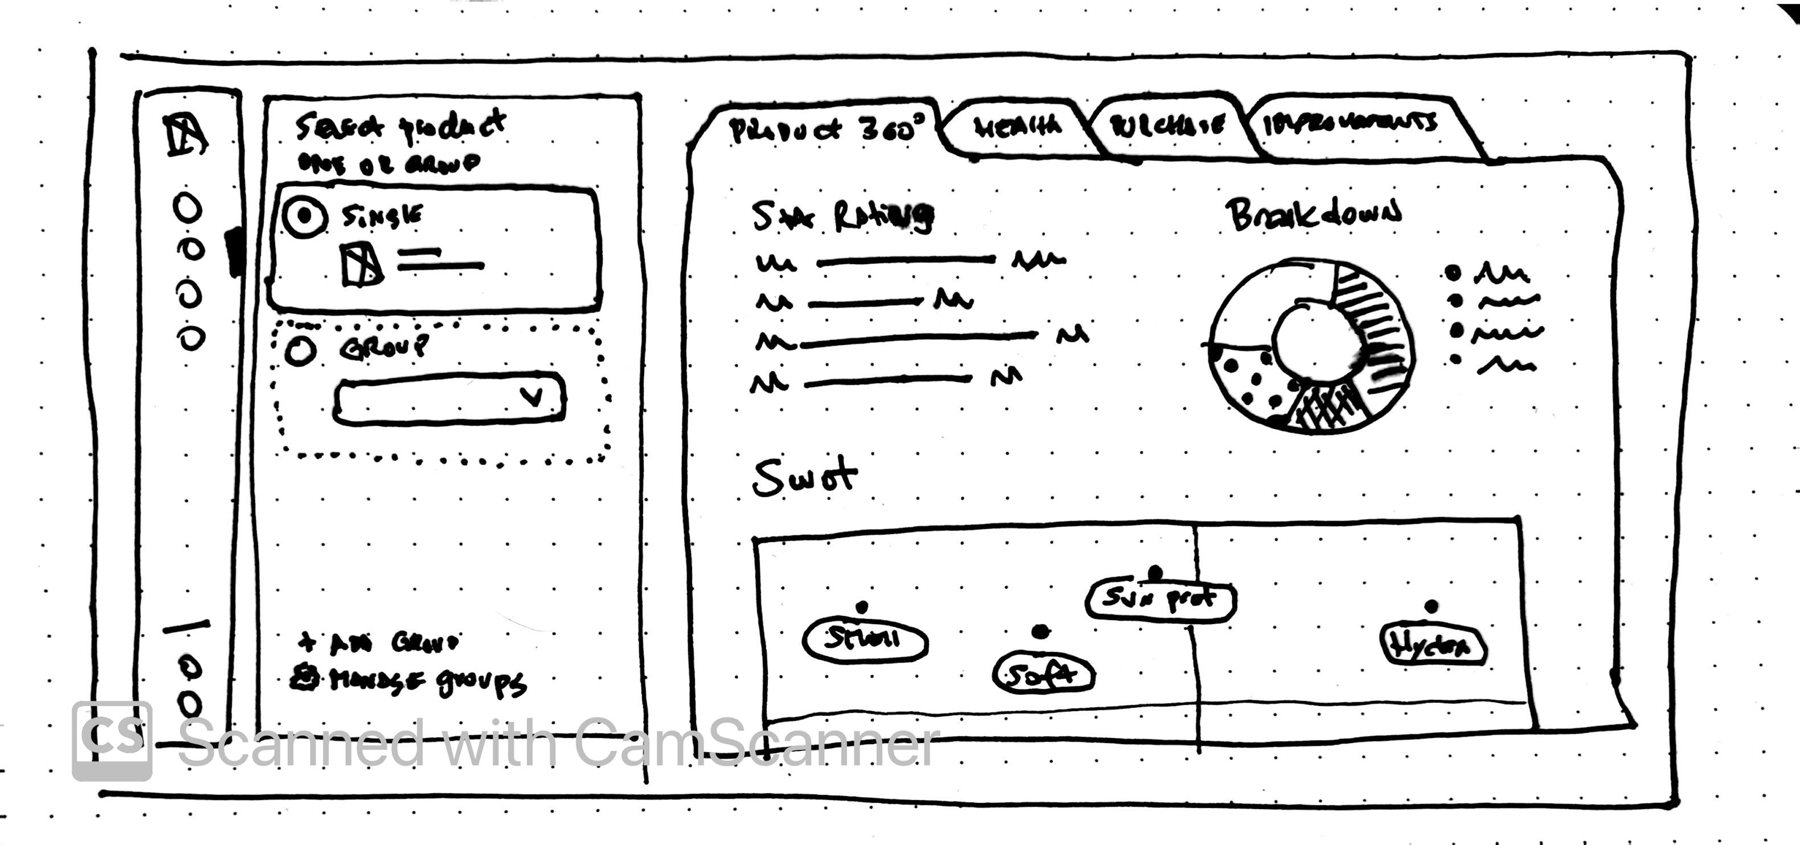
Low-fidelity sketches
Paper first, so we could discuss ideas instead of pixels. Each sketch tried a different layout. What survived was the catalog on the side and the product page split into tabs.
Designing with Claude and Figma MCP
I brainstormed with Claude and built the project incrementally, with one dedicated round for each block, reviewing and adjusting along the way. Then high fidelity with the Revuze design system.
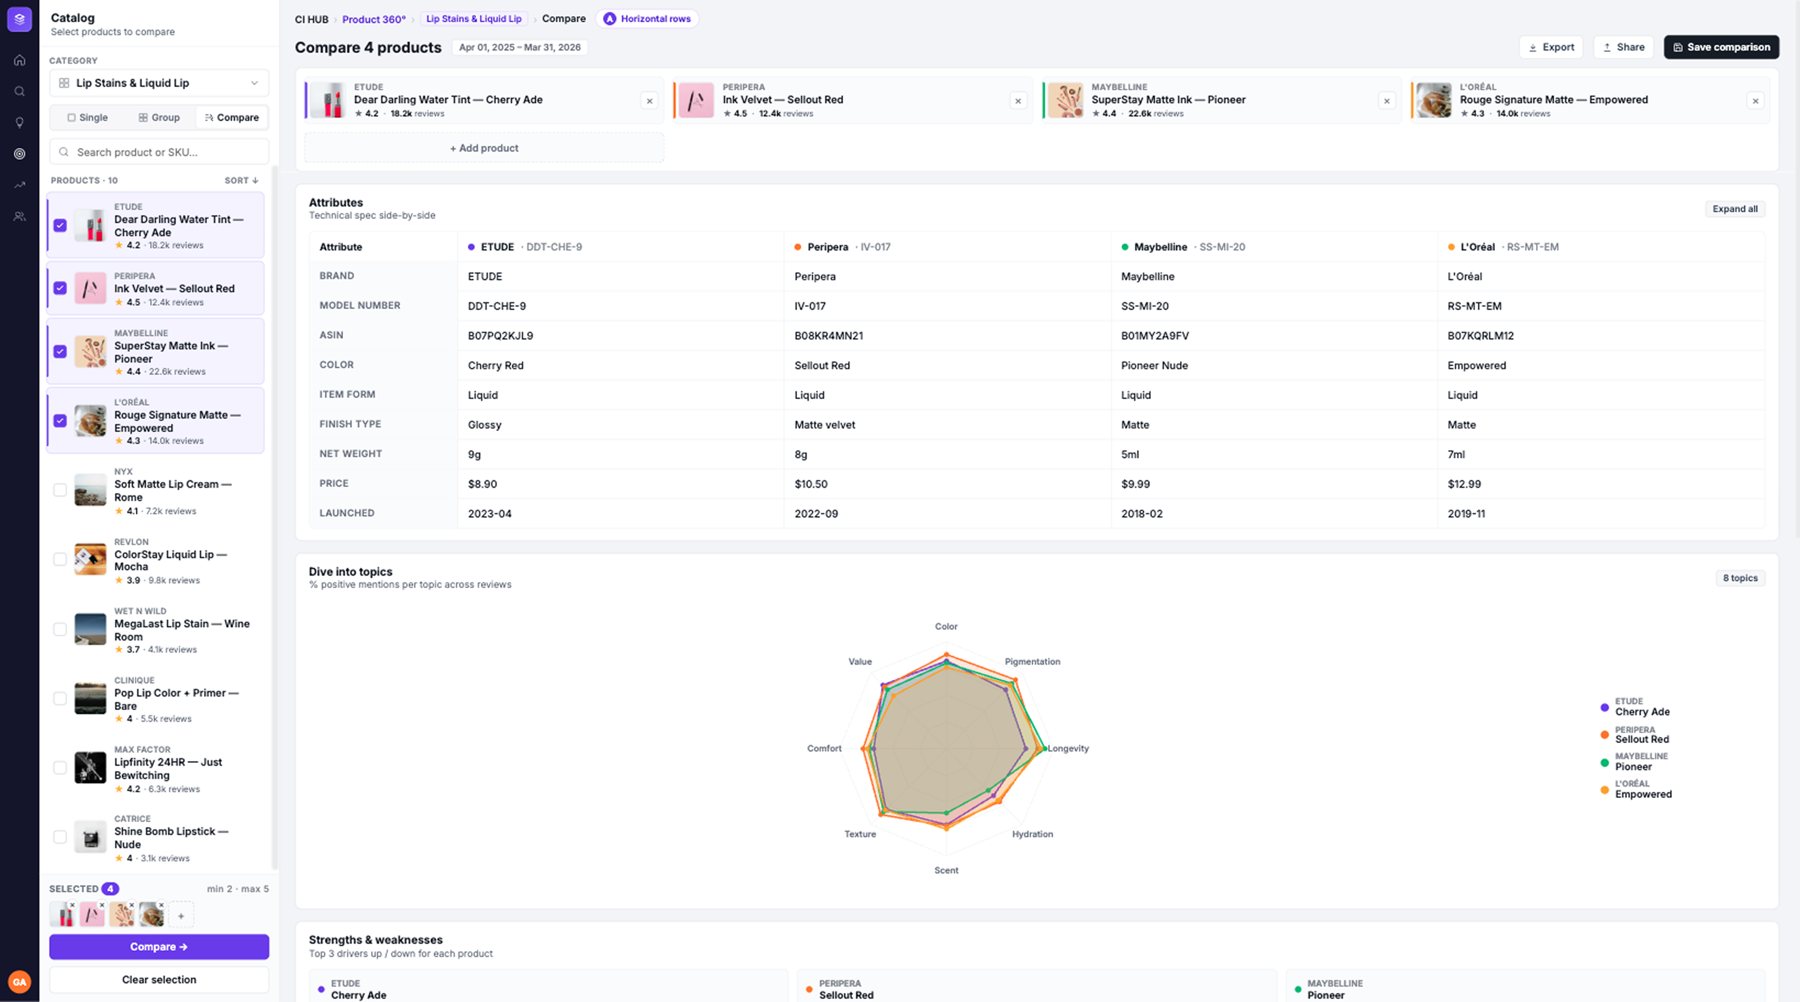
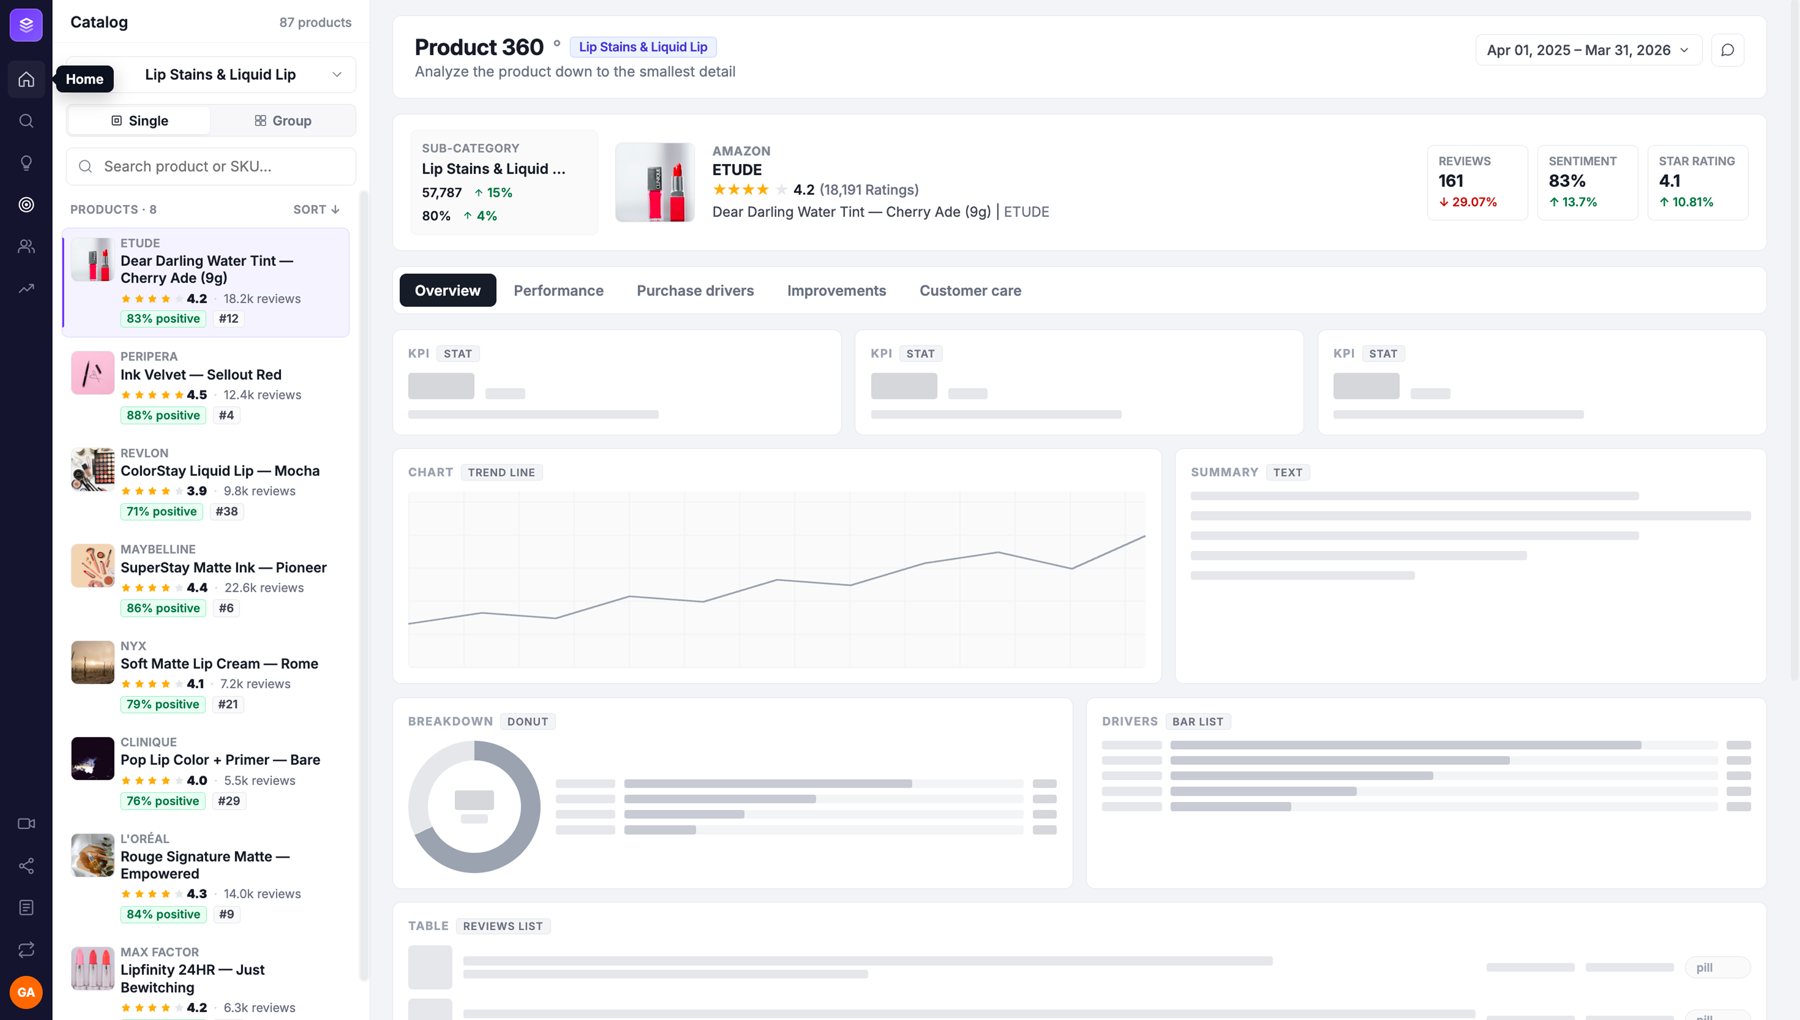
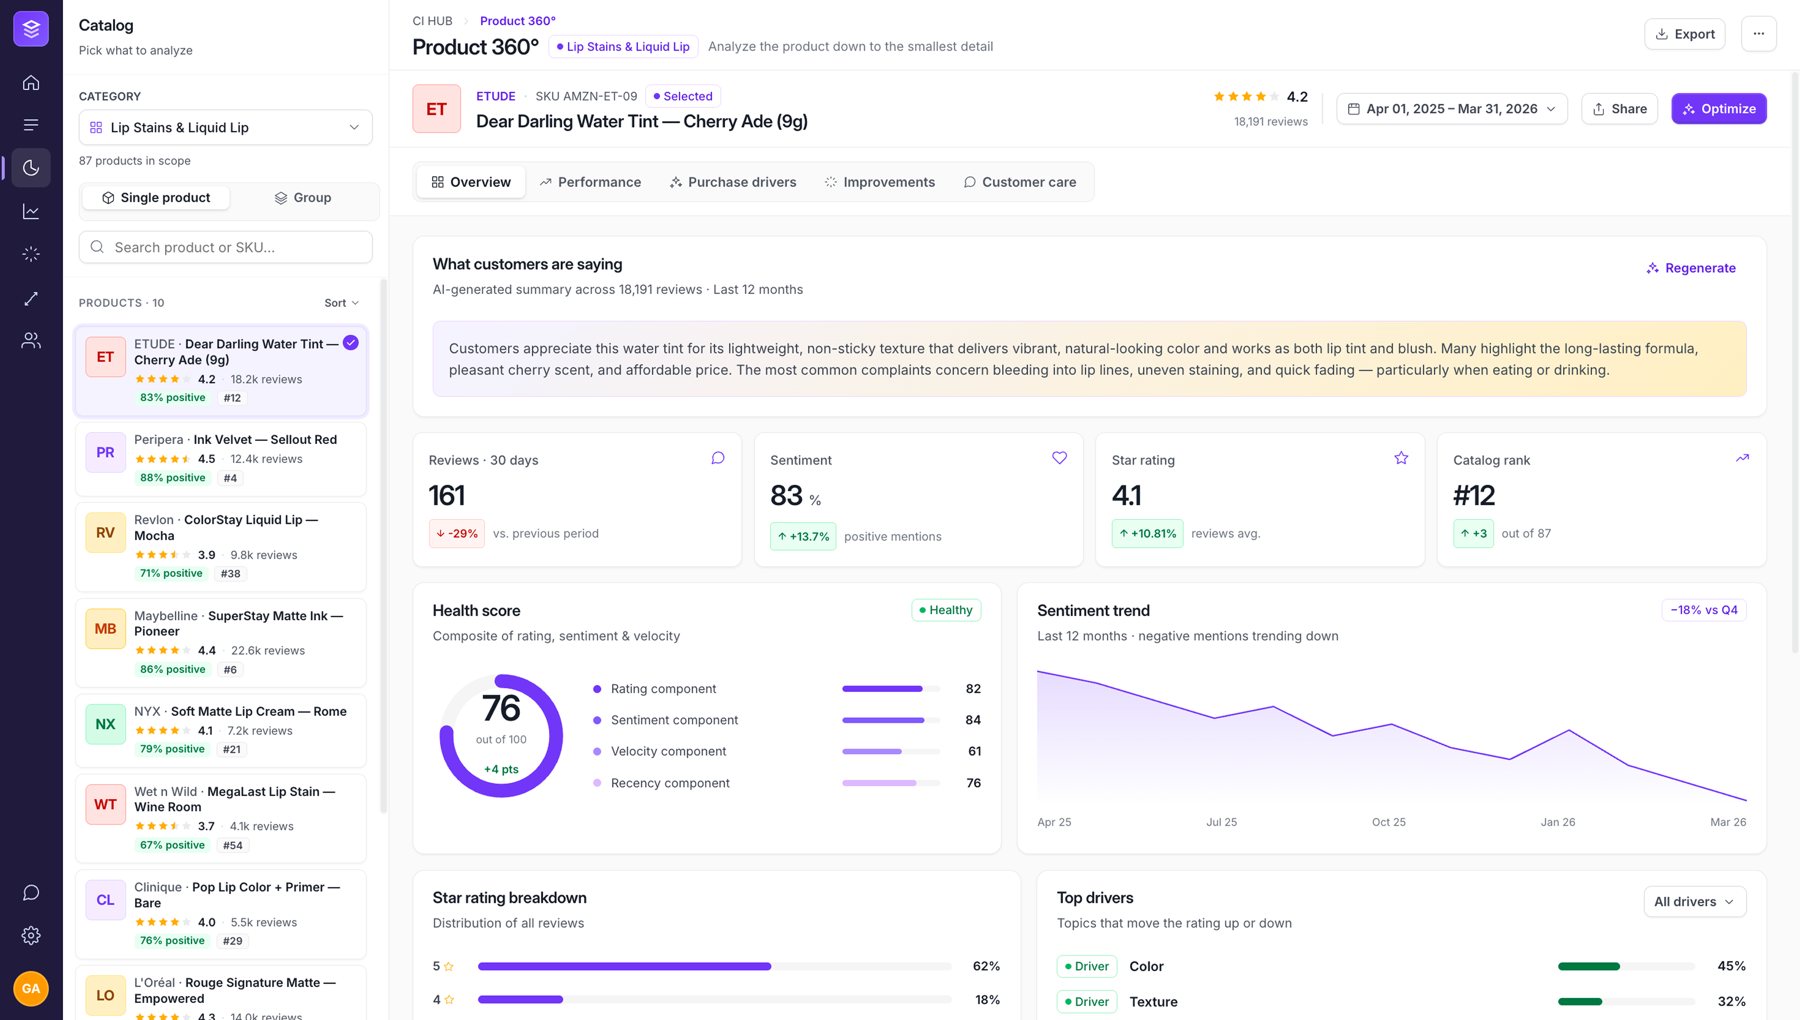
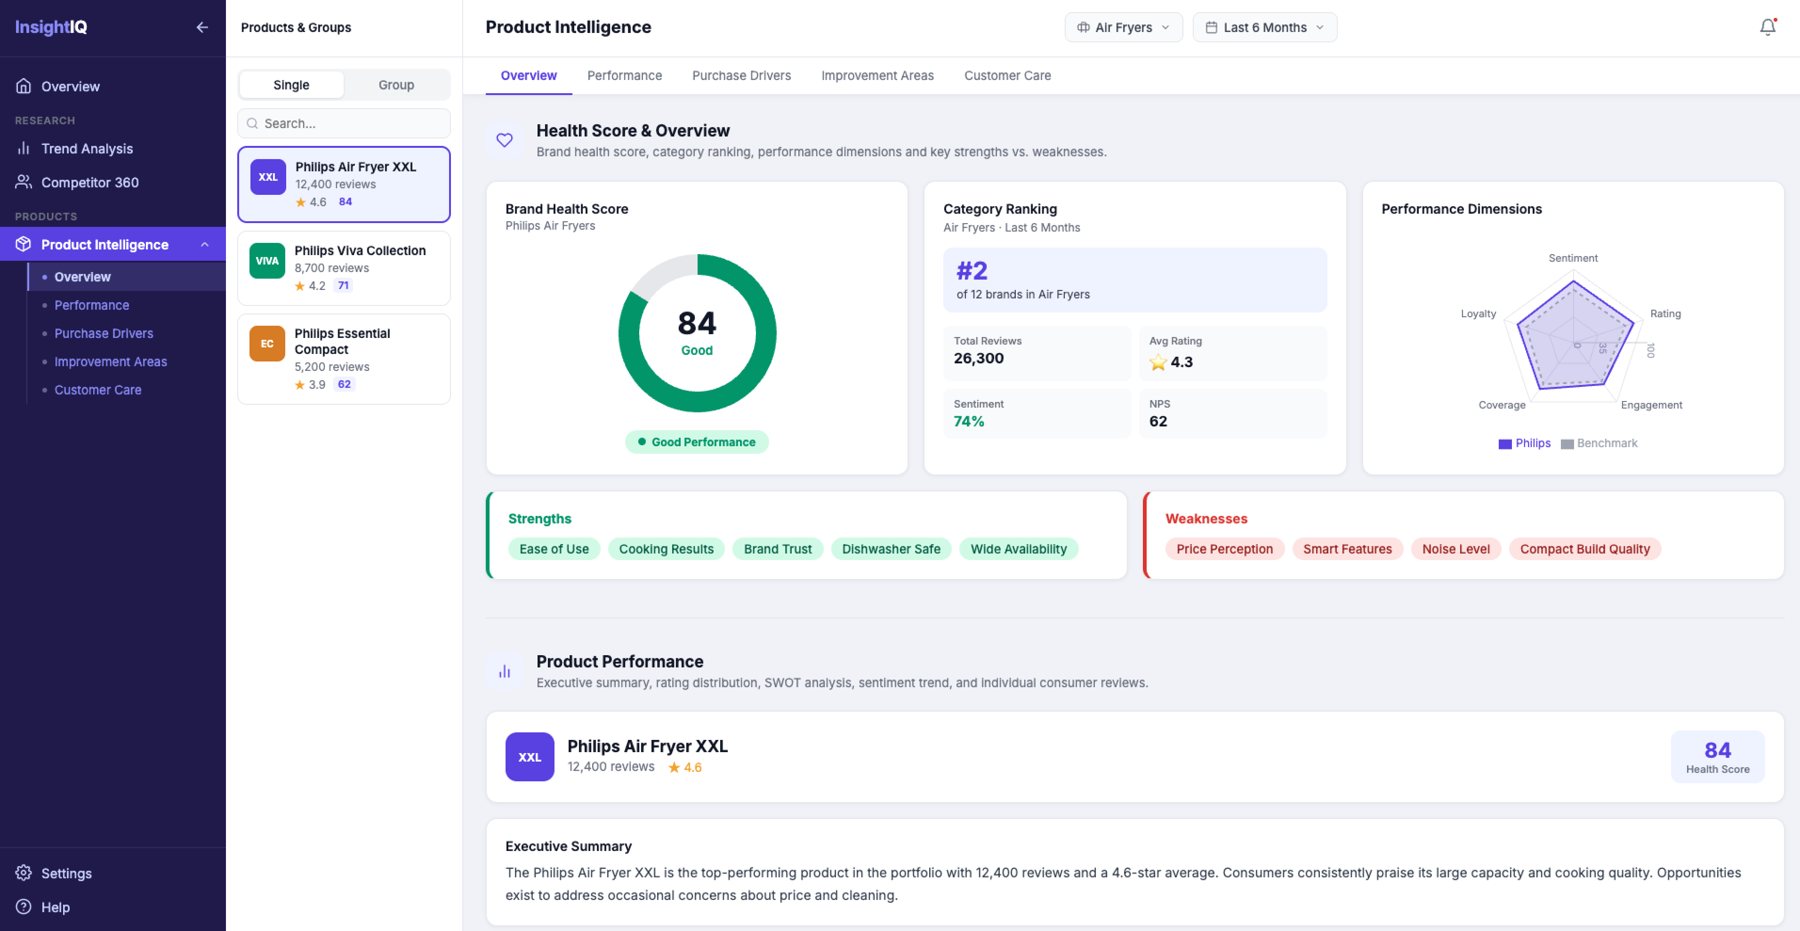
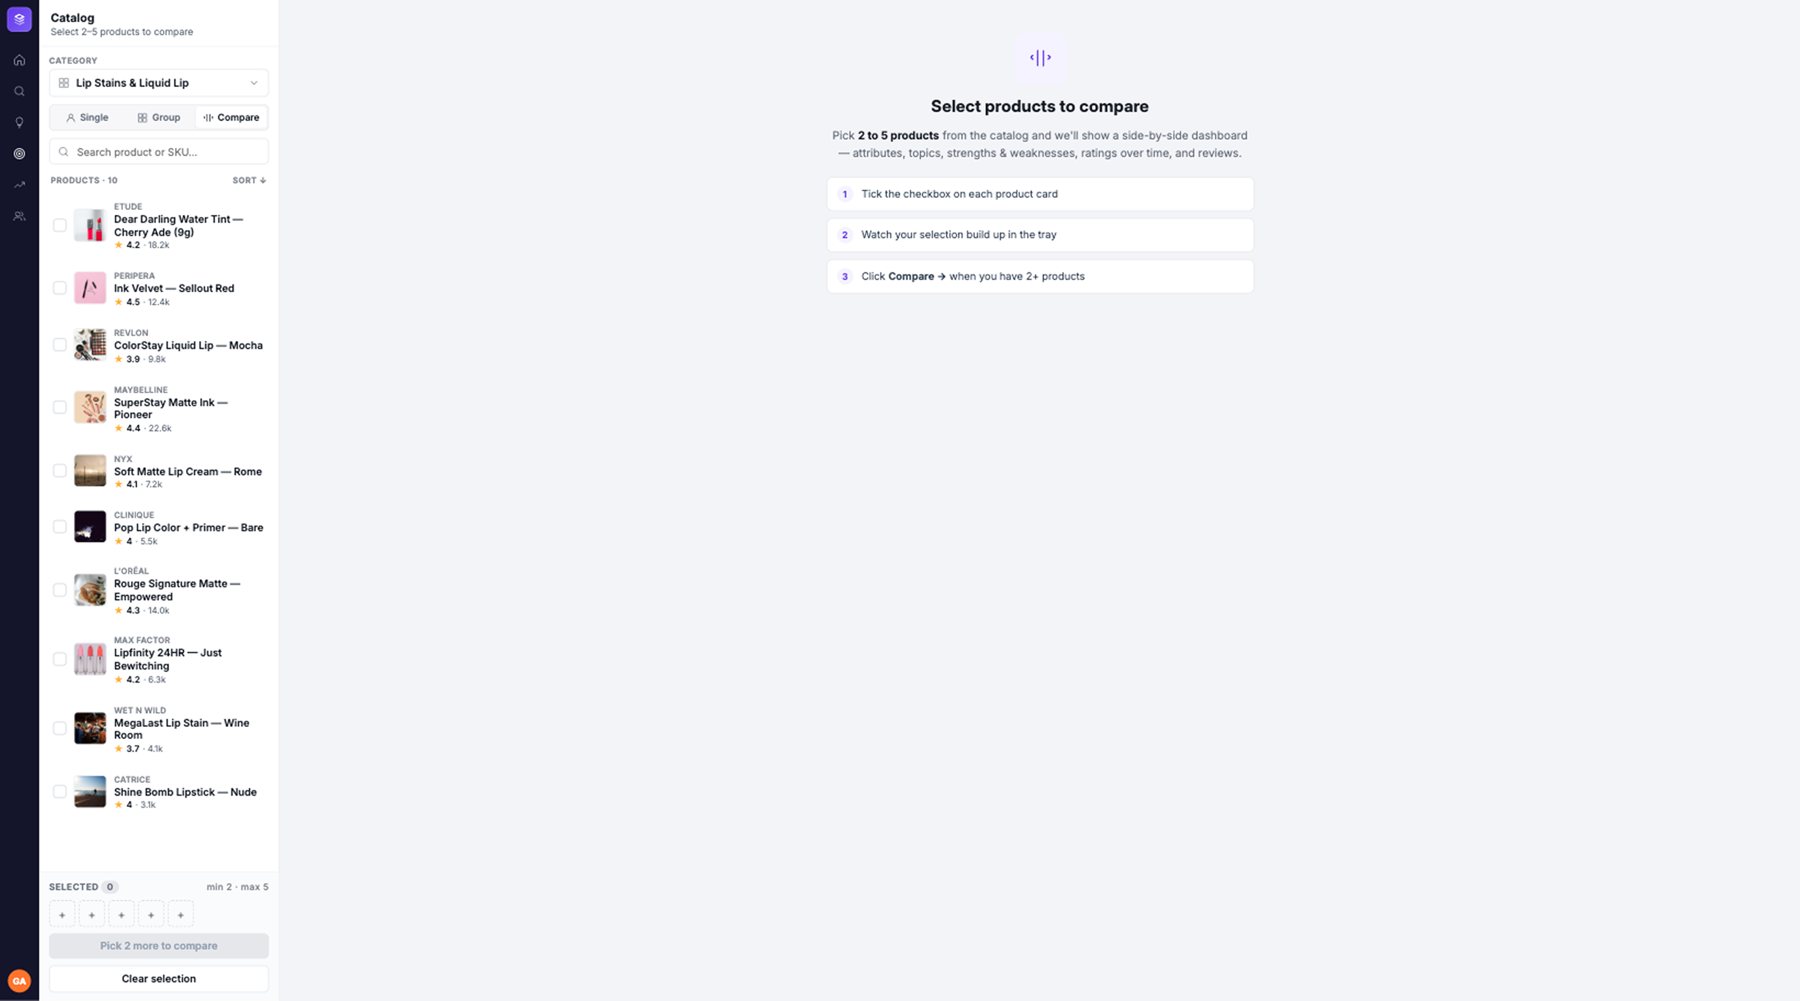
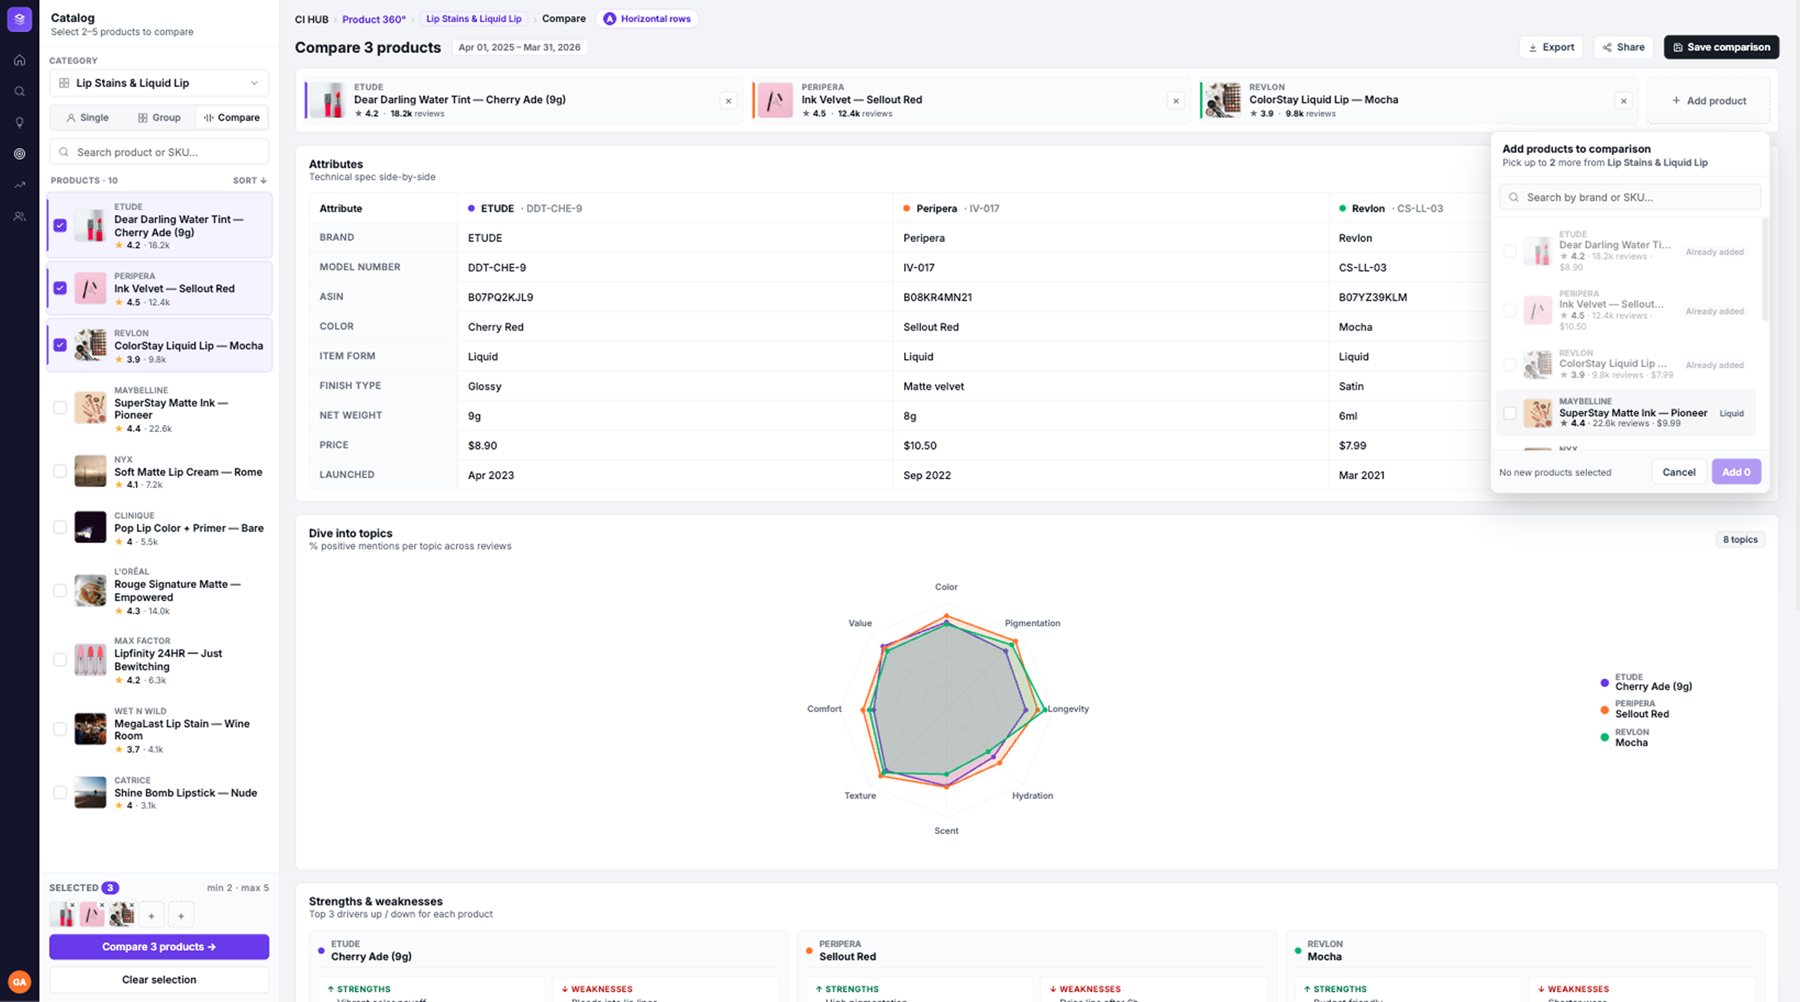
One product, one page, every answer one click away.
From the menu down to each block, every layer of the page was rebuilt around the question it answers.
One menu level instead of two
Before, hovering Core products opened a second level of six pages right over the data. Now Product 360 is a single entry: the icon shows its name on hover and one click opens the product.
Before · A hover opened a second menu level over the page.
After · One entry. A click opens the product, with its tabs inside.
Four tabs, four questions
The hidden second level became four tabs inside the product. Each one answers a different question, so switching context no longer means leaving the page. Improvement areas and purchase motivations merged, since users always read them together.
- 1OverviewHow is my product doing, and what are people saying about it?
- 2Motivations & ImprovementsWhy do people buy it, and what should we fix first?
- 3Customer CareWhat goes wrong after the purchase?
- 4Health ScoreHow does it rank against the category and its competitors?
A catalog panel instead of a page
Choosing a product used to be its own page. Now the catalog sits beside the data, with category, search, modes and sorting.
Before · Leave the data, open the menu, pick a product on its own page, press Discover. Start over to switch.
After · Pick a category, search and open a product in one click, without losing your place.
A header that collapses
Product, store, rating and the key numbers against the category. It expands when you arrive and collapses when you scroll, so the charts get more room as you read.
A page that tells one story
The blocks used to be stacked with no order. Now they go from what happened to why, and the AI summary leaves the page to become a widget.
Smart tooltips
Hover any data point and the tooltip explains it: the data, the insight and the context. Explore these reviews opens Consumer reviews already filtered, with the evidence behind that number.
Same viewport, same product. Richer insights, easier to act on.
Before · The header took about half the screen and the AI summary the rest.
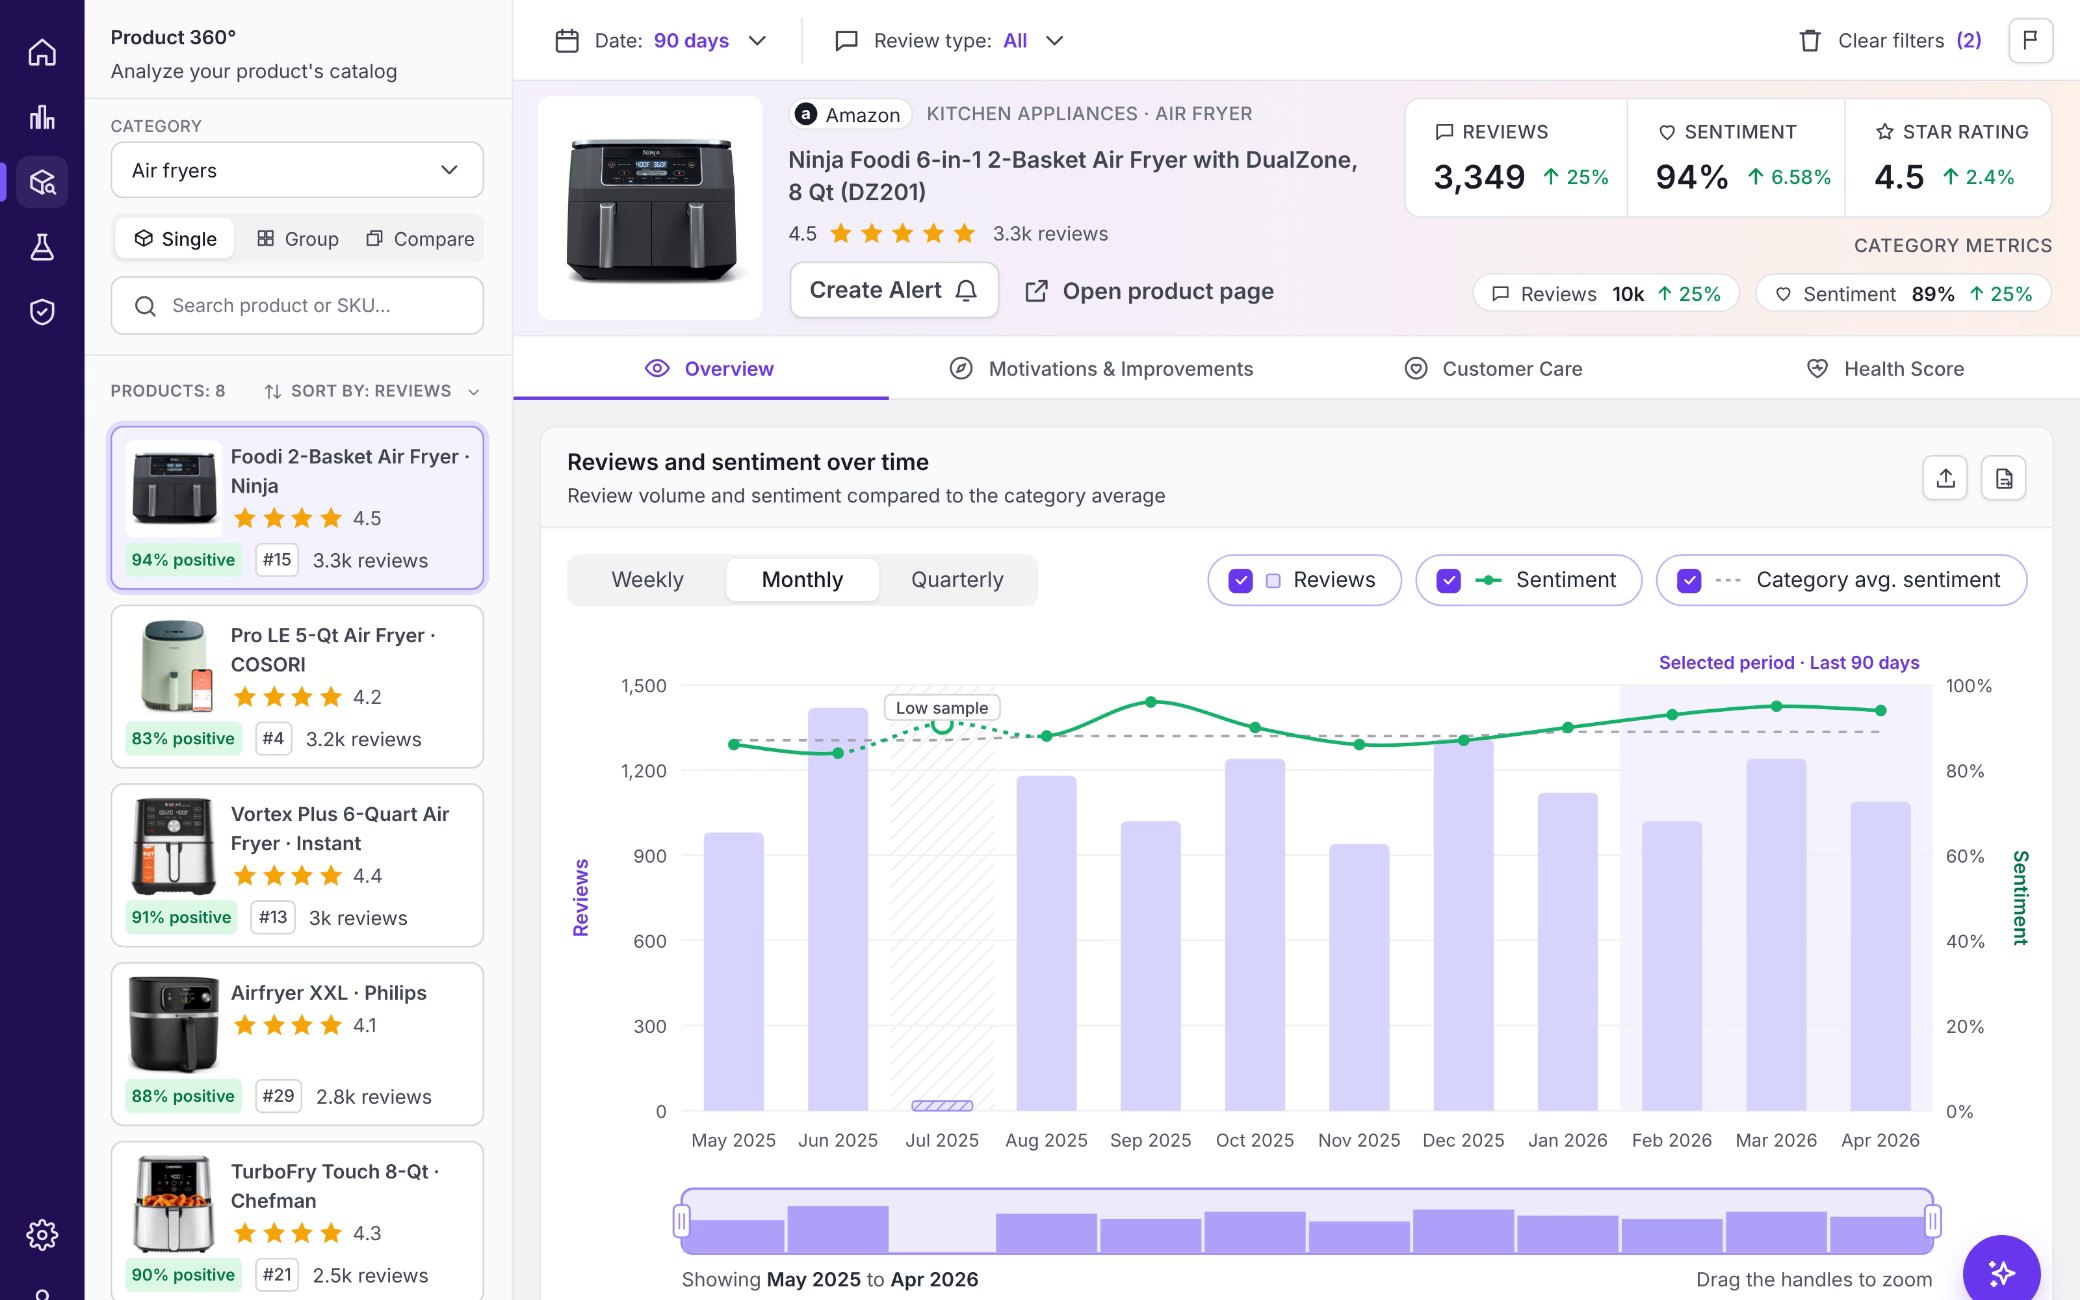
After · Charts on the first screen. The header takes about 30%, and 20% once you scroll.
With AI-generated data, mapping every possible output matters as much as the happy path.
What does this number mean? What if it looks wrong, there isn’t enough data, or something fails? Each question became a designed state, not an afterthought.
Making an AI-generated SWOT readable for any product
The SWOT plots every topic the AI finds by sentiment against the category, and overlapping labels made it hard to read. So I engineered the logic behind the layout: rules and thresholds that decide how each output is drawn and break ties when topics collide, so the UI stays sharp whatever the AI returns.
Before · Labels overlapped and the quadrants were hard to read.
After · Readable quadrants, bubbles sized by share of voice, tooltips on hover.
Position
Volume of mentions on one axis, sentiment against the category average on the other. Both together set the quadrant.
Size is share of voice
Bubbles grow with share of voice, so you see how much each topic weighs, not only where it sits.
Labels
Bigger topics always show their name. Small dots stay unlabeled and show it on hover.
Overlaps
When labels collide, the topic with more share of voice keeps its label. On a tie, the one furthest from the category average wins, negative first, because that’s where the user should look.
Why we didn’t ship it all at once.
A rebuild would have stopped every other roadmap item.
One designer, short cycles, little room for a big reveal.
A brand-new product overnight would scare the users we had.
Small steps let people learn one change at a time.
So I split the vision into middle steps. Every change was weighed by effort against impact, and the ones with the least development for the biggest improvement shipped first.
One less click to select a product
We kept the selection page, but the whole card became clickable. No radio, no Discover button. A front-end only change, built in days, that prepared users for the catalog panel.
A header that adapts as you scroll
Still on the old menu and layout, but the header now stays with you: it expands when you arrive and collapses as you scroll, so key actions like switching product or opening the product page stay within reach. Before, it scrolled out of view. A middle step toward the vision.
Before · Fixed, with no product card. To change the product you had to scroll back to the top.
Phase 2 · Stays in view, expands and collapses with the scroll, tabs inside.
Vision · Catalog panel, tabs and blocks.
Less clutter, fewer clicks, shorter paths.
Header, click, scroll and menu figures were measured on the designs.

“He took part in rethinking labels and simplifying some of our more complex flows.”
I worked with Gabriel at Revuze, where he contributed to several improvements across our product hubs, including the personalized alerts project. He took part in rethinking labels and simplifying some of our more complex flows. Gabriel was pleasant to work with, open to feedback, and a good collaborator with the team. I wish him the best in his next role.
Three things I take to every data product.
Data doesn’t retain users. Clarity does.
Revuze had the data all along. Users left because they couldn’t find it or read it.
With AI, design the what-ifs first
Missing, wrong or uncertain data is not an edge case. It’s a big part of the designer’s job now.
A vision ships through middle steps
A clear end state plus small releases moved a lean team further than one big redesign would.
- Measure the rollout30-day retention, time to first insight, tabs per session and clicks on Explore these reviews, before and after each phase.
- Group and Compare viewsThe pages behind the catalog modes: one product group at a time, and products side by side.
- Alerts that bring people backTurn Create alert into weekly digests and spike alerts, so the platform reaches users before they have to remember it.
- Trust as a metricUse Report an issue data to track how often AI numbers are questioned, and where to fix the model first.